通常做分類類型的步驟如下:
模型 → 閾值分類 → 混淆矩陣
我們可以通過調整閾值
去找表現最好的混淆矩陣
我們可以利用畫出 ROC曲線(Receiver operating characteristic curve)
來幫助我們看看我們的分類模型及較好的閾值
我們畫ROC曲線的方法
是以召回率(recall, 或稱靈敏度), 特異度(Specificity)為軸所畫出來的
| 混淆矩陣 | 真實OK | 真實NG |
|---|---|---|
| 預測OK | a | b |
| 預測NG | c | d |
召回率為 , 特異度為
以下例子舉例
樣本|A|B|C|D|E|F|G|H|I|J|K|L
--|--|--|--
真實分類|1|1|0|0|1|1|0|1|1|0|0|0
模型給值|0.8|0.6|0.2|0.6|0.9|0.3|0.4|0.7|0.5|0.4|0.8|0.2
我們嘗試把所有模型給的值都考慮成閾值候選
以此做出不同的混淆矩陣並畫出 ROC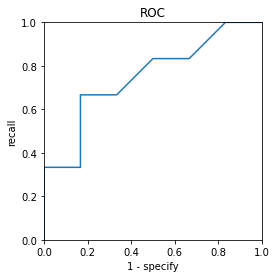
通常選擇最考慮最接近左上角(0,1)那個點作為最佳閾值
或者依你想要的場景選擇最佳閾值
import numpy as np
import matplotlib.pyplot as plt

true_class = [1, 1, 0, 0, 1, 1, 0, 1, 1, 0, 0, 0]
model_value = [0.8, 0.6, 0.2, 0.6, 0.9, 0.3, 0.4, 0.7, 0.5, 0.4, 0.8, 0.2]

def confusion_matrix(true, model, thresh):
    init = np.zeros((2,2))

    for (v, t) in zip(model, true):
        if v <= thresh:
            row = 0
        else:
            row = 1

        init[row][t] = init[row][t] + 1

    return init


indicate = sorted(list(set(model_value+[0.0, 1.0])))
recall_list = []
specify_list = []

for indi in indicate:
    conf_mat = confusion_matrix(true_class, model_value, indi)

    recall = conf_mat[0][0]/(conf_mat[0][0] + conf_mat[1][0])
    specify = conf_mat[1][1]/(conf_mat[0][1] + conf_mat[1][1])

    recall_list.append(recall)
    specify_list.append(1-specify)


fig,ax = plt.subplots()
ax.set_aspect('equal')
ax.plot(specify_list, recall_list)

ax.set_xlabel('1 - specify')
ax.set_ylabel('recall')
ax.set_title('ROC')

ax.set_xlim(0,1)
ax.set_ylim(0,1)