結束了API和權限的部分,今天要回歸WebGIS繪圖功能的部分,讓大家都可以在地圖上畫一隻或更多隻的Pokemon。
- 還記得以前有大學生研究生來參訪,我被派去演講本公司本部門的工作內容的時候,簡報大家自然是不想聽,每天都在上課已經上到非常的厭煩了,實際操作圖台大家也不怎麼有興趣,一直到我請同事在圖台上面畫一隻Pokemon,底下的學弟妹們瞬間活了起來,真的很妙xD
- 雖然那隻Pokemon (我記得是吉利蛋) 沒有任何的內容、也沒有任何的空間資訊的意義,但就是讓人耳目一新,提起大家對於空間資訊的興趣,也算是一段不錯的小插曲吧!

繪圖功能其實在WebGIS內不是算非常必要的功能,但要使用的時候沒有會很不方便,更好的方法是在繪圖以後可以儲存,並在下一次要使用的時候就可以叫出來套疊。
所以本系列預計會有3天的篇幅,從 繪圖工具的建立、儲存繪圖圖形、從儲存的繪圖還原回去圖台上。我花了蠻多時間在儲存和還原的部分,不只形狀要還原、顏色透明度也要還原,這個需要考量到Openlayer的Graphic格式與其function,這系列我會寫出我使用的方法,若有人有更好的方式也可以提出來互相討論。
繪圖的工具一定要有以下幾種繪圖方法:
以上繪圖皆要能調整顏色和透明度,為了讓顏色選取較為方便,將套用Colorpicker模組,而透明度則是利用slider去調整。
顏色:引入 spectrum ,用於Colorpicker。透明度:使用jQuery的 slider 模組。Colorpicker的工具有很多,思考了很久評估了一下,spectrum雖然ui很醜,但功能和可設定的部分較多較自由,且可以自己調整css讓樣式比較好看些。 (但css是我的罩門,所以我這邊還是用原本的樣式)
於 map_module/widget/ExpertModule/ 建立繪圖工具的頁面 Draw.html。
以下先顯示點的頁面,點的大小下拉式選單直接寫死幾個選項,也可以讓使用者進行填寫,但為了避免麻煩和需要判斷內容是否合法 (全形半形、是否為數字),所以直接寫固定的下拉選單比較方便。
<!DOCTYPE html>
<html>
<head>
    <meta charset="utf-8" />
    <title></title>
    <link type="text/css" href="css/Plug_in/spectrum.css" rel="stylesheet" />
</head>
<body>
    <h2>繪圖工具</h2>
    <div>
        <div class="ui top attached tabular menu">
            <a class="item active" data-tab="point">點</a>
            <a class="item" data-tab="line">折線</a>
            <a class="item" data-tab="polygon">多邊形</a>
            <a class="item" data-tab="text">文字</a>
            <a class="item" data-tab="save">儲存</a>
        </div>
        <!-- 點 -->
        <div class="ui bottom attached tab segment active" data-tab="point">
            <table style="width:100%" class="attributetable" id="pointattribute">
                <tr>
                    <td>大小:</td>
                    <td>
                        <div class="ui fluid selection dropdown">
                            <input type="hidden" id="pointsize" value="8">
                            <i class="dropdown icon"></i>
                            <div class="text">8</div>
                            <div class="menu">
                                <div class="item" data-value="8">8</div>
                                <div class="item" data-value="10">10</div>
                                <div class="item" data-value="12">12</div>
                                <div class="item" data-value="14">14</div>
                                <div class="item" data-value="16">16</div>
                                <div class="item" data-value="18">18</div>
                            </div>
                        </div>
                    </td>
                </tr>
                <tr>
                    <td>填充顏色:</td>
                    <td>
                        <div class="ui fluid input">
                            <input type="text" id="pointfillcolor">
                        </div>
                    </td>
                </tr>
                <tr>
                    <td>透明度:</td>
                    <td>
                        <div class="ui range" id="pointfillopacity"></div>
                    </td>
                </tr>
                <tr>
                    <td colspan="2" style="text-align:center;">
                        <button type="button" class="ui fluid blue button" id="pointdraw"
                        onclick="draw.drawpoint()">繪點</button>
                    </td>
                </tr>
            </table>
        </div>
        <!-- 折線 -->
        <!-- 多邊形 -->
        <!-- 文字 -->
        <!-- 儲存 -->
        <div style="width:90%;margin: auto;">
            <button type="button" class="ui fluid negative button" id="cleardraw"
            onclick="draw.clearalldraw()">清除全部圖面繪圖</button>
        </div>
    </div>
    <script type="text/javascript" src="js/Plug_in/spectrum.js"></script>
    <script type="text/javascript" src="map_module/widget/ExpertModule/jDraw.js"></script>
        <script>
        $('.menu .item').tab();
        $('.ui.dropdown').dropdown();
    </script>
</body>
</html>
點的 顏色spectrum 和 透明度slider 初始化。
// 顏色
$("#pointfillcolor").spectrum({
    preferredFormat: "hex",
    color: "#FF0000",
    change: function (color) {
        color.toHexString();
        console.log(color.toHexString())
    }
});
// 透明度
$('#pointfillopacity').slider({
    min: 0,
    max: 100,
    value: 50,
    slide: function (e, ui) {
        console.log(ui.value)
    }
});
繪點頁面示意圖: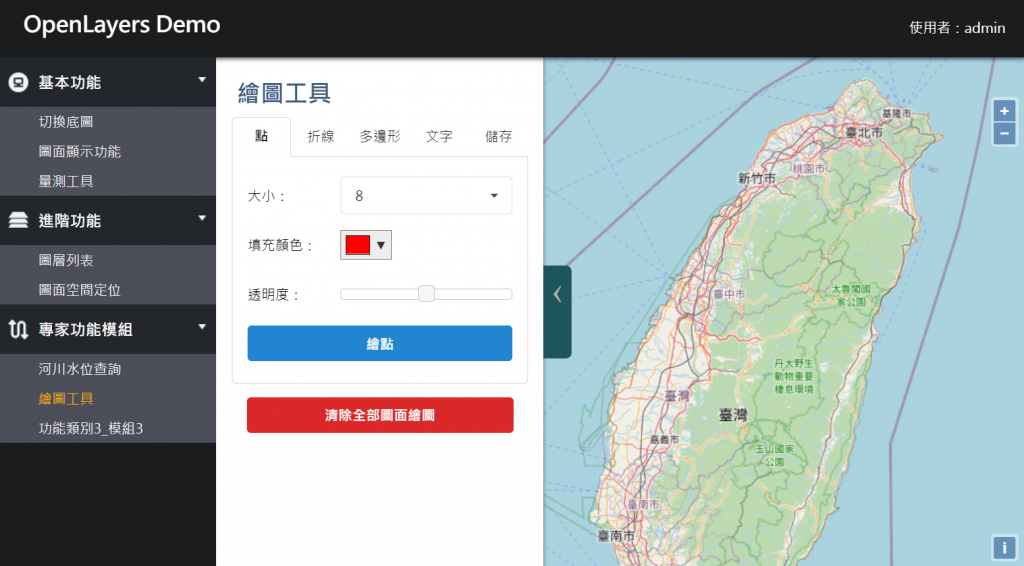
以下補完線、多邊形和文字:
繪製折線頁面建立
<!-- 折線 -->
<div class="ui bottom attached tab segment" data-tab="line">
    <table style="width:100%" class="attributetable" id="lineattribute">
        <tr>
            <td>線寬:</td>
            <td>
                <div class="ui fluid selection dropdown">
                    <input type="hidden" id="linewidth" value="2">
                    <i class="dropdown icon"></i>
                    <div class="text">2</div>
                    <div class="menu">
                        <div class="item" data-value="1">1</div>
                        <div class="item" data-value="2">2</div>
                        <div class="item" data-value="3">3</div>
                        <div class="item" data-value="4">4</div>
                        <div class="item" data-value="5">5</div>
                        <div class="item" data-value="6">6</div>
                        <div class="item" data-value="8">8</div>
                        <div class="item" data-value="10">10</div>
                    </div>
                </div>
            </td>
        </tr>
        <tr>
            <td>顏色:</td>
            <td>
                <div class="ui fluid input">
                    <input type="text" id="linefillcolor">
                </div>
            </td>
        </tr>
        <tr>
            <td>透明度:</td>
            <td>
                <div class="ui range" id="linefillopacity"></div>
            </td>
        </tr>
        <tr>
            <td colspan="2" style="text-align:center;">
                <button type="button" class="ui fluid blue button" id="linedraw" onclick="draw.drawline()">繪線</button>
            </td>
        </tr>
    </table>
</div>
繪製折線顏色、透明度初始化。
$("#linefillcolor").spectrum({
    preferredFormat: "hex",
    color: "#FF0000",
    change: function (color) {
        color.toHexString();
        console.log(color.toHexString())
    }
});
$('#linefillopacity').slider({
    min: 0,
    max: 100,
    value: 50,
    slide: function (e, ui) {
        console.log(ui.value)
    }
});
繪製多邊形頁面建立:
<div class="ui bottom attached tab segment" data-tab="polygon">
    <table style="width:100%" class="attributetable" id="polygonattribute">
        <tr>
            <td>顏色:</td>
            <td>
                <div class="ui fluid input">
                    <input type="text" id="polygonfillcolor">
                </div>
            </td>
        </tr>
        <tr>
            <td>透明度:</td>
            <td>
                <div class="ui range" id="polygonfillopacity"></div>
            </td>
        </tr>
        <tr>
            <td>外框寬度:</td>
            <td>
                <div class="ui fluid selection dropdown">
                    <input type="hidden" id="polygonoutlinewidth" value="2">
                    <i class="dropdown icon"></i>
                    <div class="text">2</div>
                    <div class="menu">
                        <div class="item" data-value="1">1</div>
                        <div class="item" data-value="2">2</div>
                        <div class="item" data-value="3">3</div>
                        <div class="item" data-value="4">4</div>
                        <div class="item" data-value="5">5</div>
                        <div class="item" data-value="6">6</div>
                        <div class="item" data-value="8">8</div>
                        <div class="item" data-value="10">10</div>
                    </div>
                </div>
            </td>
        </tr>
        <tr>
            <td>外框顏色:</td>
            <td>
                <div class="ui fluid input">
                    <input type="text" id="polygonoutlinecolor">
                </div>
            </td>
        </tr>
        <tr>
            <td>外框透明度:</td>
            <td>
                <div class="ui range" id="polygonoutlineopacity"></div>
            </td>
        </tr>
        <tr>
            <td colspan="2" style="text-align:center;">
                <button type="button" class="ui blue button drawpolybtn"
                onclick="draw.drawpolygon('Polygon')">繪多邊形</button>
                <button type="button" class="ui blue button drawpolybtn"
                onclick="draw.drawpolygon('Circle')">繪圓形</button>
                <button type="button" class="ui blue button drawpolybtn"
                onclick="draw.drawpolygon('Square')">繪正方形</button>
                <button type="button" class="ui blue button drawpolybtn"
                onclick="draw.drawpolygon('Box')">繪長方形</button>
            </td>
        </tr>
    </table>
</div>
繪製多邊形顏色、透明度初始化,分別有:
$("#polygonfillcolor").spectrum({
    preferredFormat: "hex",
    color: "#FF0000",
    change: function (color) {
        color.toHexString();
        console.log(color.toHexString())
    }
});
$("#polygonoutlinecolor").spectrum({
    preferredFormat: "hex",
    color: "#000000",
    change: function (color) {
        color.toHexString();
        console.log(color.toHexString())
    }
});
$('#polygonfillopacity').slider({
    min: 0,
    max: 100,
    value: 50,
    slide: function (e, ui) {
        console.log(ui.value)
    }
});
$('#polygonoutlineopacity').slider({
    min: 0,
    max: 100,
    value: 100,
    slide: function (e, ui) {
        console.log(ui.value)
    }
});
標註文字頁面建立:
<div class="ui bottom attached tab segment" data-tab="text">
    <table style="width:100%" class="attributetable" id="textattribute">
        <tr>
            <td>大小:</td>
            <td>
                <div class="ui fluid selection dropdown">
                    <input type="hidden" id="textsize" value="20">
                    <i class="dropdown icon"></i>
                    <div class="text">20</div>
                    <div class="menu">
                        <div class="item" data-value="12">12</div>
                        <div class="item" data-value="14">14</div>
                        <div class="item" data-value="16">16</div>
                        <div class="item" data-value="18">18</div>
                        <div class="item" data-value="20">20</div>
                        <div class="item" data-value="24">24</div>
                        <div class="item" data-value="30">30</div>
                        <div class="item" data-value="36">36</div>
                        <div class="item" data-value="48">48</div>
                    </div>
                </div>
            </td>
        </tr>
        <tr>
            <td>顏色:</td>
            <td>
                <div class="ui fluid input">
                    <input type="text" id="textfillcolor">
                </div>
            </td>
        </tr>
        <tr>
            <td>透明度:</td>
            <td>
                <div class="ui range" id="textfillopacity"></div>
            </td>
        </tr>
        <tr>
            <td>內容:</td>
            <td>
                <div class="ui fluid input">
                    <input type="text" id="textcontent">
                </div>
            </td>
        </tr>
        <tr>
            <td colspan="2" style="text-align:center;">
                <button type="button" class="ui fluid blue button" id="textdraw" onclick="draw.drawtext()">繪製文字</button>
            </td>
        </tr>
    </table>
</div>
繪製文字顏色、透明度初始化
$("#textfillcolor").spectrum({
    preferredFormat: "hex",
    color: "#008bff",
    change: function (color) {
        color.toHexString();
        console.log(color.toHexString())
    }
});
$('#textfillopacity').slider({
    min: 0,
    max: 100,
    value: 100,
    slide: function (e, ui) {
        console.log(ui.value)
    }
});
.ui.menu a.item {
    width: calc(100%/5);
    padding: 10px 0px !important;
    text-align: center;
    display: block !important;
}
.attributetable tr {
    height: 50px;
}
.attributetable td:first-child {
    width: 35%;
}
.drawpolybtn {
    width: 45%;
    margin: 3px !important;
}
繪圖工具頁面共4個分頁示意圖,由左到右分別為:點、折線、多邊形、文字。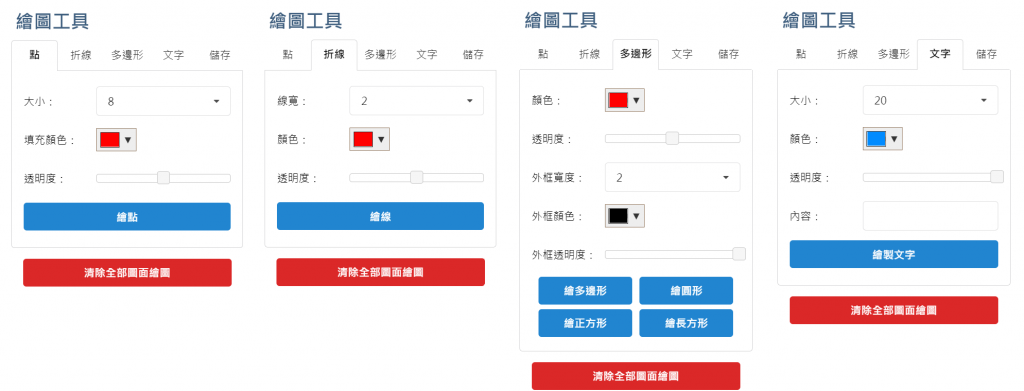
新增繪圖工具的程式碼頁面 jDraw.js ,並引入Draw.html內。
設定 draw 全域變數,一載入即進行圖層的判斷:
drawLyr。並設定其有幾個可以對外使用的function:
drawpoint():繪點功能。drawline():繪折線功能。drawpolygon():繪多邊形功能。drawtext():標註文字功能。clearalldraw():清除所有繪圖之功能。var draw = function () {
var drawLyr;
var source = new ol.source.Vector({
});
if (map.e_getLayer("drawLyr") === undefined) {
drawLyr = new ol.layer.Vector({
source: source
});
drawLyr.id = "drawLyr";
map.addLayer(drawLyr);
} else {
drawLyr = map.e_getLayer("drawLyr");
}
return {
drawpoint: drawpoint,
drawline: drawline,
drawpolygon: drawpolygon,
drawtext: drawtext,
clearalldraw: clearalldraw
};
}();
建立 addInteraction(),主要是利用 ol.interaction.Draw 進行繪圖toolbar的建立,放入相對應的geometry、style、type 等資料。
但其中 Square 和 Box 這兩者的 geometryFunction 參數需要另外定義,因此另外撰寫判斷式。
最後將 drawtool 利用 map.addInteraction() 綁定到地圖上,但當繪圖完成後,除了設定樣式外,立即解除綁定 map.removeInteraction 。
function addInteraction(value, style) {
    var geometryFunction, maxPoints;
    if (value === 'Square') {
        value = 'Circle';
        geometryFunction = ol.interaction.Draw.createRegularPolygon(4);
    } else if (value === 'Box') {
        value = 'LineString';
        maxPoints = 2;
        geometryFunction = function (coordinates, geometry) {
            var start = coordinates[0];
            var end = coordinates[1];
            if (!geometry) {
                geometry = new ol.geom.Polygon([
                    [start, [start[0], end[1]], end, [end[0], start[1]], start]
                ]);
            }
            geometry.setCoordinates([
                [start, [start[0], end[1]], end, [end[0], start[1]], start]
            ]);
            return geometry;
        };
    }
    var drawtool = new ol.interaction.Draw({
        source: source,
        type: value,
        geometryFunction: geometryFunction,
        maxPoints: maxPoints,
        stopClick: true
    });
    map.addInteraction(drawtool);
    drawtool.on('drawend', function (event) {
        event.feature.setStyle(style);
        map.removeInteraction(drawtool);
    });
}
drawpoint() ,以此類推。drawpoint()、drawline()、drawpolygon()、drawtext() 這4個function,以下以點為例。
#pointfillcolor 得到顏色,並轉為HEX。#pointfillopacity 得到透明度,並轉為值閾0~1之間的數值,0為透明、1為不透明。addInteraction("Point", style) 進行工具的建立。function drawpoint() {
var color = ol.color.asArray($("#pointfillcolor").spectrum("get").toHexString());
color = color.slice();
color[3] = $("#pointfillopacity").slider("value") / 100;
var style = new ol.style.Style({
fill: new ol.style.Fill({
color: color
}),
stroke: new ol.style.Stroke({
color: color,
width: 2
}),
image: new ol.style.Circle({
radius: $("#pointsize").val(),
fill: new ol.style.Fill({
color: color
})
})
});
addInteraction("Point", style);
}
function drawline() {
var fillcolor = ol.color.asArray($("#linefillcolor").spectrum("get").toHexString());
fillcolor = fillcolor.slice();
fillcolor[3] = $("#linefillopacity").slider("value") / 100;
var style = new ol.style.Style({
fill: new ol.style.Fill({
color: fillcolor
}),
stroke: new ol.style.Stroke({
color: fillcolor,
width: $("#linewidth").val()
})
});
addInteraction("LineString", style);
}
function drawpolygon(type) {
var fillcolor = ol.color.asArray($("#polygonfillcolor").spectrum("get").toHexString());
fillcolor = fillcolor.slice();
fillcolor[3] = $("#polygonfillopacity").slider("value") / 100;
var strokecolor = ol.color.asArray($("#polygonoutlinecolor").spectrum("get").toHexString());
strokecolor = strokecolor.slice();
strokecolor[3] = $("#polygonoutlineopacity").slider("value") / 100;
var style = new ol.style.Style({
fill: new ol.style.Fill({
color: fillcolor
}),
stroke: new ol.style.Stroke({
color: strokecolor,
width: $("#polygonoutlinewidth").val()
})
});
addInteraction(type, style);
}
function drawtext() {
var fillcolor = ol.color.asArray($("#textfillcolor").spectrum("get").toHexString());
fillcolor = fillcolor.slice();
fillcolor[3] = $("#textfillopacity").slider("value") / 100;
var style = new ol.style.Style({
text: new ol.style.Text({
text: $("#textcontent").val(),
font: 'bold ' + $("#textsize").val() + 'px Times New Roman',
fill: new ol.style.Fill({
color: fillcolor
}),
stroke: new ol.style.Stroke({
color: fillcolor,
width: 0.5
})
})
});
addInteraction("Point", style);
}
因我們將所有繪圖都放置在 drawLyr 這個圖層內,因此若要清除圖層即直接將drawLyr內的所有graphic清除即可。
function clearalldraw() {
    if (map.e_getLayer("drawLyr") !== undefined) {
        map.e_getLayer("drawLyr").getSource().clear();
    }
}
除了可以讓使用這新增繪圖以外,應要搭配 編修 的功能,否則每次畫錯都只能刪掉重劃。
此功能設計為每次新增完後即可點選編輯,但這部分目前只撰寫 編輯圖案形狀 的功能,若大家有需要可以自己撰寫編輯顏色、透明度。
var Modify = {
    init: function () {
        this.select = new ol.interaction.Select();
        map.addInteraction(this.select);
        this.modify = new ol.interaction.Modify({
            features: this.select.getFeatures()
        });
        map.addInteraction(this.modify);
        this.setEvents();
    },
    setEvents: function () {
        var selectedFeatures = this.select.getFeatures();
        this.select.on('change:active', function () {
            selectedFeatures.forEach(selectedFeatures.remove, selectedFeatures);
        });
    },
    setActive: function (active) {
        this.select.setActive(active);
        this.modify.setActive(active);
    }
};
Modify.init();
Modify.setActive(true);
繪圖示意圖: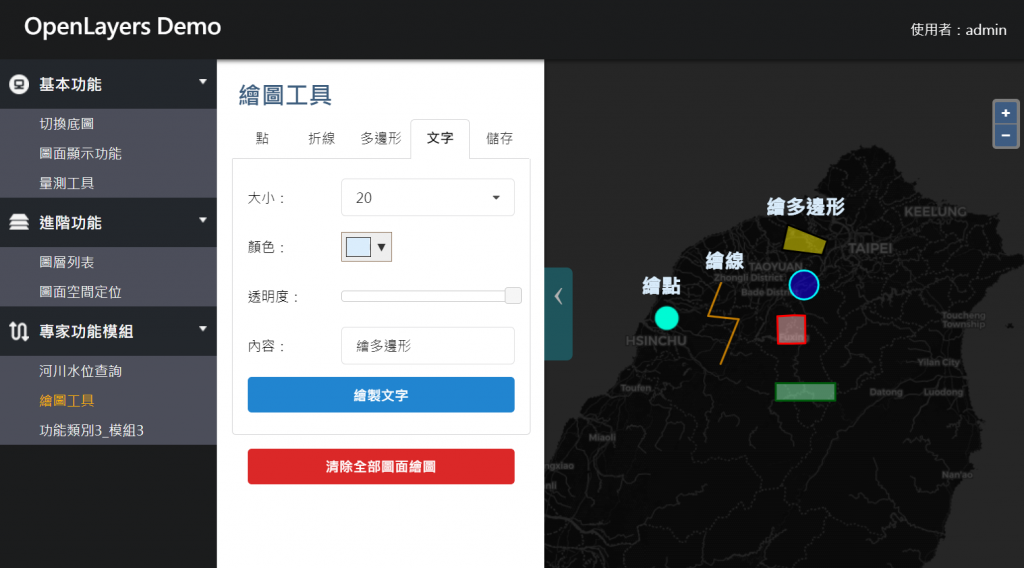
今天已經完成了繪圖功能的建立和可以提供編輯的功能,但還少了一塊就是儲存的部分。
由於我們現在已完成了權限的控管,要有使用者的資訊才能進行 個人化圖形 的儲存,所以明天就要來說明如何儲存我們畫出來的圖形!
(這也是為什麼這個功能寫在權限控管之後了~)