今天來討論前端RWD的套件、表格的套件、圖表的套件分別有哪些好用的、可以當作參考。
目前js相關的前端套件非常多,使用者可以依據自己的需求進行選擇,有些為擴充性高的、有些為較簡單使用的、有些介面好看 等等的,可嘗試討討砍、使用看看。
分為RWD套件、表格、圖表:
<button type="button" class="btn btn-primary">Primary</button>
<button type="button" class="btn btn-secondary">Secondary</button>
<button type="button" class="btn btn-success">Success</button>
<button type="button" class="btn btn-danger">Danger</button>
<button type="button" class="btn btn-warning">Warning</button>
<button type="button" class="btn btn-info">Info</button>
<button type="button" class="btn btn-light">Light</button>
<button type="button" class="btn btn-dark">Dark</button>
<button type="button" class="btn btn-link">Link</button>

<button class="ui primary basic button">Primary</button>
<button class="ui secondary basic button">Secondary</button>
<button class="ui positive basic button">Positive</button>
<button class="ui negative basic button">Negative</button>

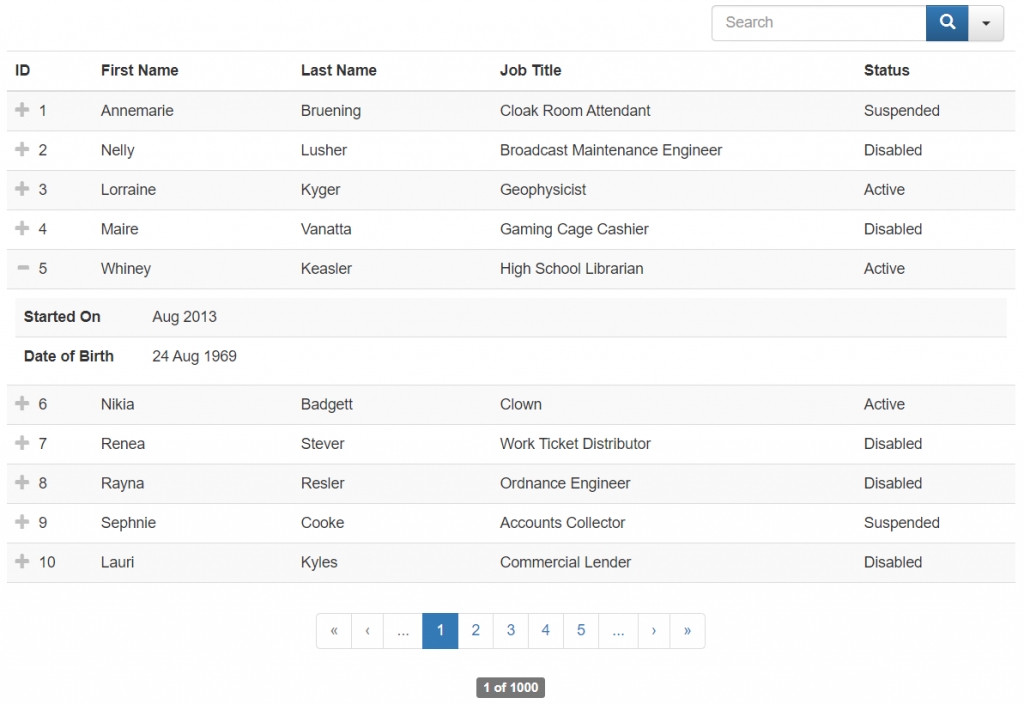
20 Useful Javascript Data Table Libraries 提供20種Table的library,不過仔細觀察,有些表格套件不是這麼的好用。
我自己在選擇的時候,希望能達到以下目標:
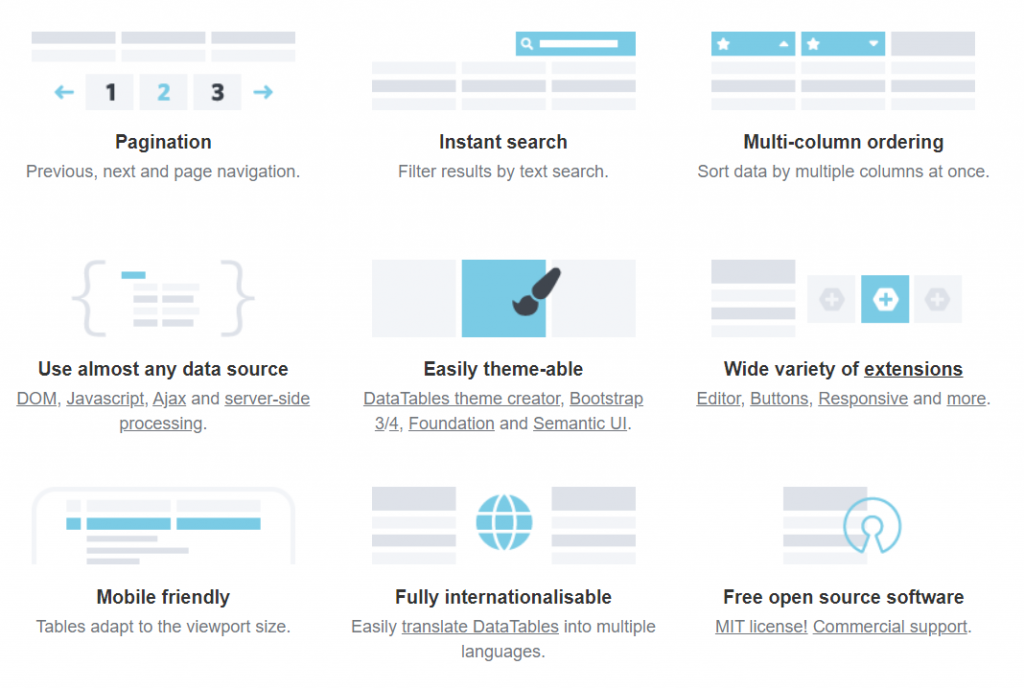
但很可惜的是目前我還沒看到有一個這麼完整的套件,但最常使用的就是DataTables和FooTable,以下說明DataTables內容。

function Employee ( name, position, salary, office ) {
    this.name = name;
    this.position = position;
    this.salary = salary;
    this._office = office;

    this.office = function () {
        return this._office;
    }
};

$('#example').DataTable( {
    data: [
        new Employee( "Tiger Nixon", "System Architect", "$3,120", "Edinburgh" ),
        new Employee( "Garrett Winters", "Director", "$5,300", "Edinburgh" )
    ],
    columns: [
        { data: 'name' },
        { data: 'salary' },
        { data: 'office' },
        { data: 'position' }
    ]
} );

jQuery(function($){
	$('#modal-example-1').footable({
		"useParentWidth": true,
		"columns": $.get('columns.json'),
		"rows": $.get('rows.json')
	});
});

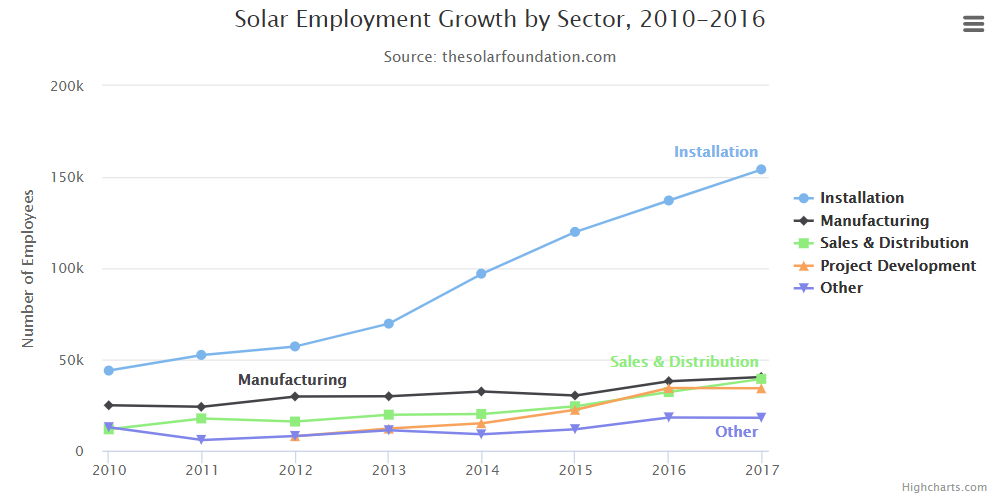
Highcharts.chart('container', {
    title: {
        text: 'Solar Employment Growth by Sector, 2010-2016'
    },
    subtitle: {
        text: 'Source: thesolarfoundation.com'
    },
    yAxis: {
        title: {
            text: 'Number of Employees'
        }
    },
    xAxis: {
        accessibility: {
            rangeDescription: 'Range: 2010 to 2017'
        }
    },
    legend: {
        layout: 'vertical',
        align: 'right',
        verticalAlign: 'middle'
    },
    plotOptions: {
        series: {
            label: {
                connectorAllowed: false
            },
            pointStart: 2010
        }
    },
    series: [{
        name: 'Installation',
        data: [43934, 52503, 57177, 69658, 97031, 119931, 137133, 154175]
    }, {
        name: 'Manufacturing',
        data: [24916, 24064, 29742, 29851, 32490, 30282, 38121, 40434]
    }, {
        name: 'Sales & Distribution',
        data: [11744, 17722, 16005, 19771, 20185, 24377, 32147, 39387]
    }, {
        name: 'Project Development',
        data: [null, null, 7988, 12169, 15112, 22452, 34400, 34227]
    }, {
        name: 'Other',
        data: [12908, 5948, 8105, 11248, 8989, 11816, 18274, 18111]
    }],
    responsive: {
        rules: [{
            condition: {
                maxWidth: 500
            },
            chartOptions: {
                legend: {
                    layout: 'horizontal',
                    align: 'center',
                    verticalAlign: 'bottom'
                }
            }
        }]
    }
});

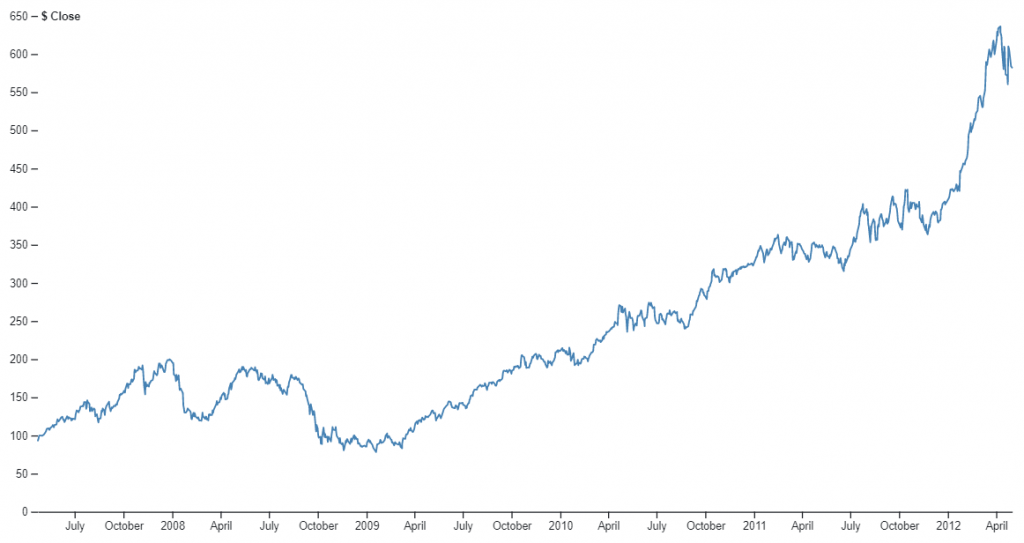
line = d3.line()
    .defined(d => !isNaN(d.value))
    .x(d => x(d.date))
    .y(d => y(d.value));
x = d3.scaleUtc()
    .domain(d3.extent(data, d => d.date))
    .range([margin.left, width - margin.right]);
y = d3.scaleLinear()
    .domain([0, d3.max(data, d => d.value)]).nice()
    .range([height - margin.bottom, margin.top]);
xAxis = g => g
    .attr("transform", `translate(0,${height - margin.bottom})`)
    .call(d3.axisBottom(x).ticks(width / 80).tickSizeOuter(0))
yAxis = g => g
    .attr("transform", `translate(${margin.left},0)`)
    .call(d3.axisLeft(y))
    .call(g => g.select(".domain").remove())
    .call(g => g.select(".tick:last-of-type text").clone()
        .attr("x", 3)
        .attr("text-anchor", "start")
        .attr("font-weight", "bold")
        .text(data.y))
chart = {
  const svg = d3.create("svg")
      .attr("viewBox", [0, 0, width, height]);

  svg.append("g")
      .call(xAxis);

  svg.append("g")
      .call(yAxis);

  svg.append("path")
      .datum(data)
      .attr("fill", "none")
      .attr("stroke", "steelblue")
      .attr("stroke-width", 1.5)
      .attr("stroke-linejoin", "round")
      .attr("stroke-linecap", "round")
      .attr("d", line);

  return svg.node();
}

明天我們將這些前端套件應用於系統開發上,來學習如何撈取並展示時序性GPS觀測解算資料。
