今天我們要學習如何 展示全台GPS三維形變的時序性資料 ,這個功能是把這28天以前學到的東西做一個統整,把整個流程串起來,跟以往比較不一樣的是這次的資料來源為 實體檔案 ,要從實體檔案讀入後再拆解判斷回傳,流程如下:
今天的內容會稍多,不像之前一個功能拆成2、3天去寫。
可以在 中研院地球科學研究所 GPS LAB 的網頁下載 全台GPS CORS站 的資料。
如下圖,DOWNLOAD TIME SRIES,目前可以下載到 2019.12.31,會有一個約半年的時間差。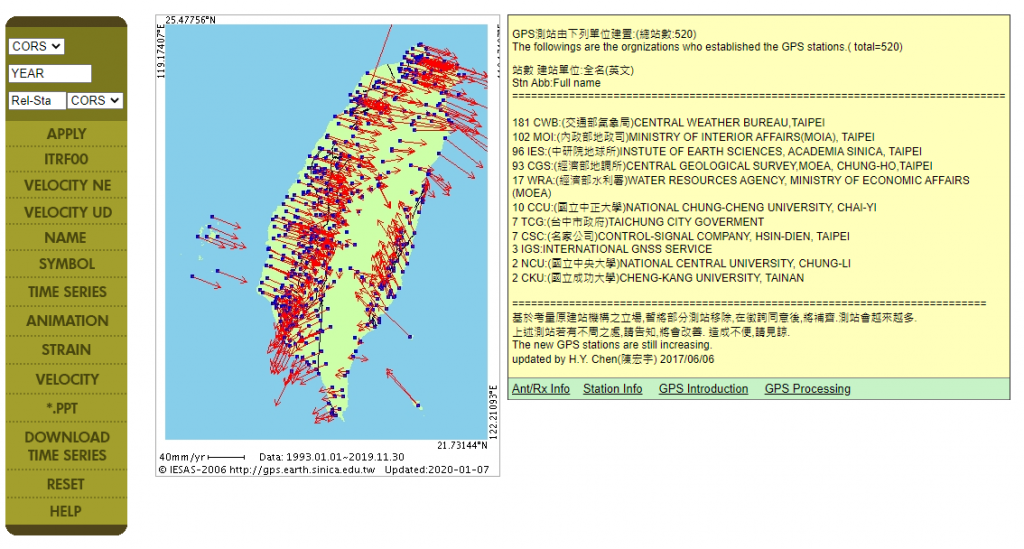
它是以測站代碼為檔名,一個測站一個檔,而每個檔的欄位內容如下:
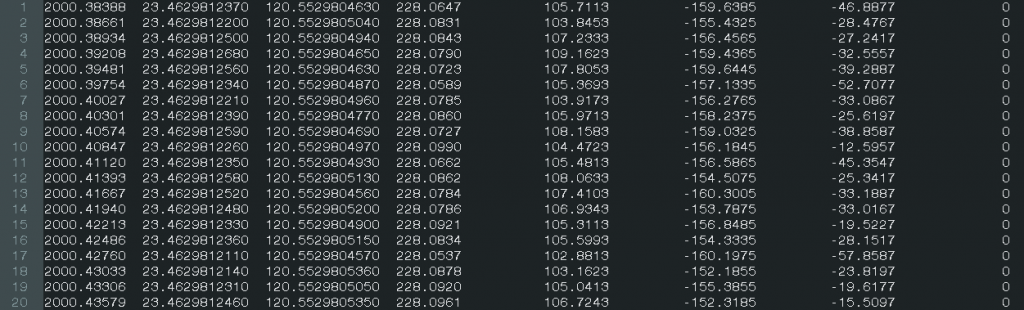
由上面的資料可以看出年的資料為換算成小數點格式的型態,但由原始資料難以直接看出 實際的年月日,勢必一定要對它資料處理進行格式的轉換,另外,由於 每個測站的開始與結束時間都不一樣 ,因此也要注意測站的時間間隔區間進行處理。
我的方法採用撰寫 python3 程式碼,批次且自動化進行日期的轉換,將 帶有小數點的年 轉換成 年月日(yyyyMMdd) 的格式。
同時輸出 GPS_Station.txt 統整所有測站資訊,包含該測站起始與結束的時間。
# -*- coding: utf-8 -*-
"""
@author: JYHsu
@version: Python 3.4
@createdate: 2019-05-01
"""

from datetime import datetime, timedelta
from numpy import loadtxt
import io
import time
import glob
import os

def float_year_to_datetime(given_time_in_year):
    given_year = int(given_time_in_year)
    remaining_time = given_time_in_year - given_year
    base = datetime(given_year, 1, 1)
    result = base + timedelta(seconds=(base.replace(year=base.year + 1) - base).total_seconds() * remaining_time)
    # Rounding off to days
    result = result.replace(hour=0, minute=0, second=0, microsecond=0)
    result = result + timedelta(days=1)
    return result

def run_convert(filename,folder_path):
    s = open(filename).read().replace('\t',' ') #讀檔
    data = loadtxt(io.StringIO(s)).astype(str)
    sdate = ""
    edate = ""
    for i in range(len(data)):
        timeArray = time.strptime(str(float_year_to_datetime(float(data[i][0]))), "%Y-%m-%d %H:%M:%S") #時間格式轉換
        data[i][0] = time.strftime("%Y%m%d", timeArray)
        if i == 0:
            sdate = data[i][0];
        if i == (len(data)-1):
            edate = data[i][0];
            # 將統整資料統一寫入GPS_Station.txt檔
            with open(folder_path + "GPS_Station.txt", "a") as inte_file:
                inte_file.write(sdate + "," + edate + "," + data[i][1]+ "," + data[i][2]+ "," + data[i][3]+ "," + data[i][4]+ "," + data[i][5]+ "," + data[i][6]+ "," + data[i][7]+ "," + filename.replace(".COR", "") + "\n")
    # 日期轉換後同欄位寫入新檔案
    with open(folder_path+filename, "w") as txt_file:
        for line in data:
            txt_file.write(" ".join(line) + "\n")

if __name__ == '__main__':
    folder_path = "./GPS_Station/";
    if not os.path.exists(folder_path):
        os.makedirs(folder_path)
    # 撈出該資料夾所有的.COR檔
    for i in glob.glob('*.COR'):
        # 將每個檔一一進行轉換
        run_convert(i,folder_path)
        print(i)
轉換後的檔案內容示意圖: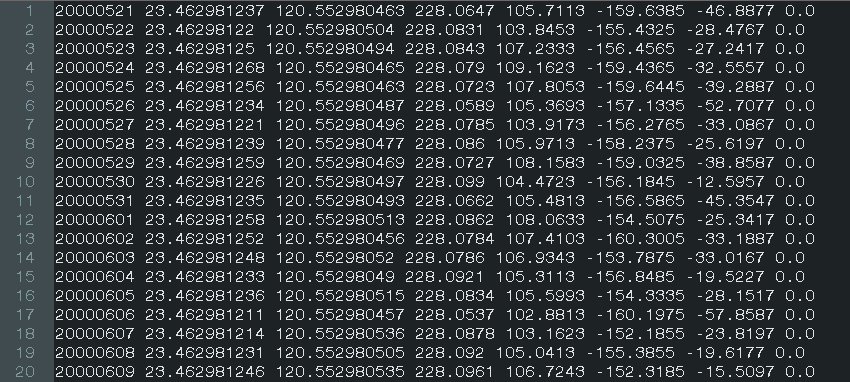
用上述Python程式碼轉換可能會有 1天 的時間差,但由於使用此種GPS資料是想要看 長期的趨勢,對於1日的時間差較不在意,可忽略。
由於目前的資料只有測站代碼與圖面資料,但這樣會難以查詢,因此若能以縣市去區分應該縮小查詢區域。可以將 GPS_Station.txt 轉存為shapefile檔,並與 縣市界 的shapefile檔進行 SpatialJoin ,新增縣市COUNTYNAME 屬性。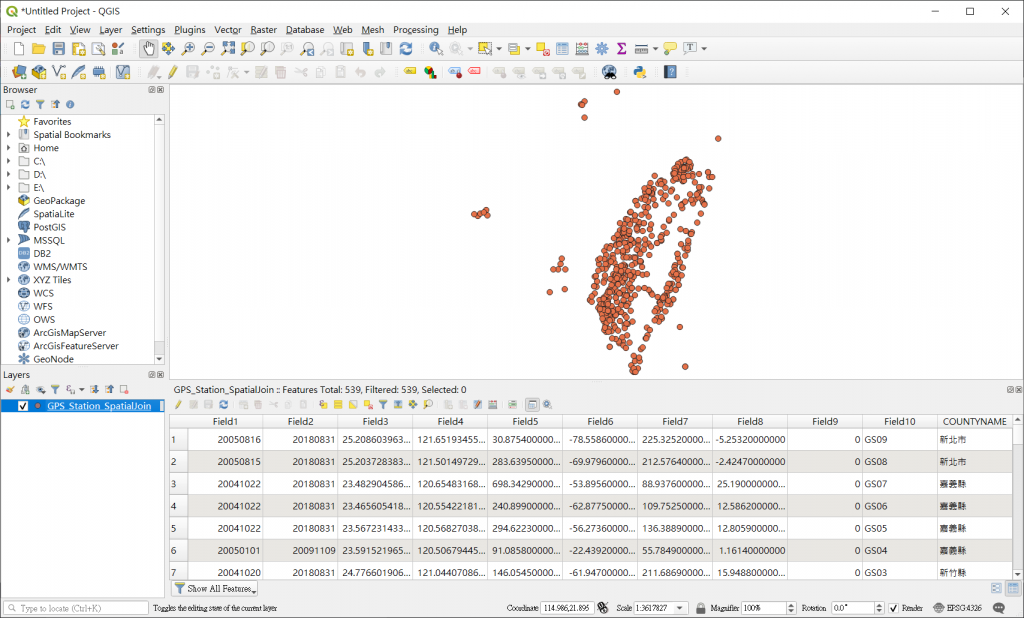
Day 5 的時候有說明如何將shp匯入資料庫,匯入後的DB示意圖: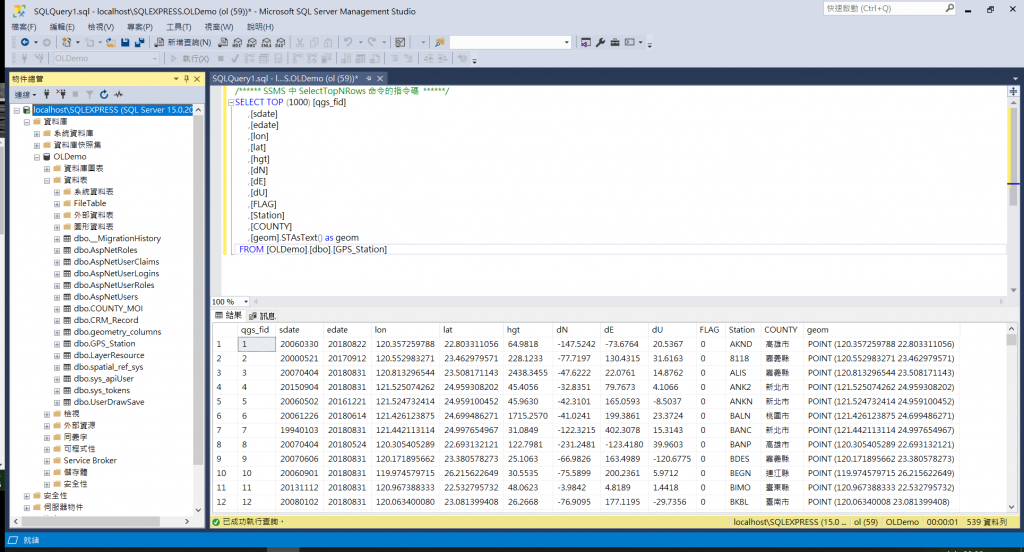
從資料庫撈出圖層資料,並設定其 樣式、Scale區間。
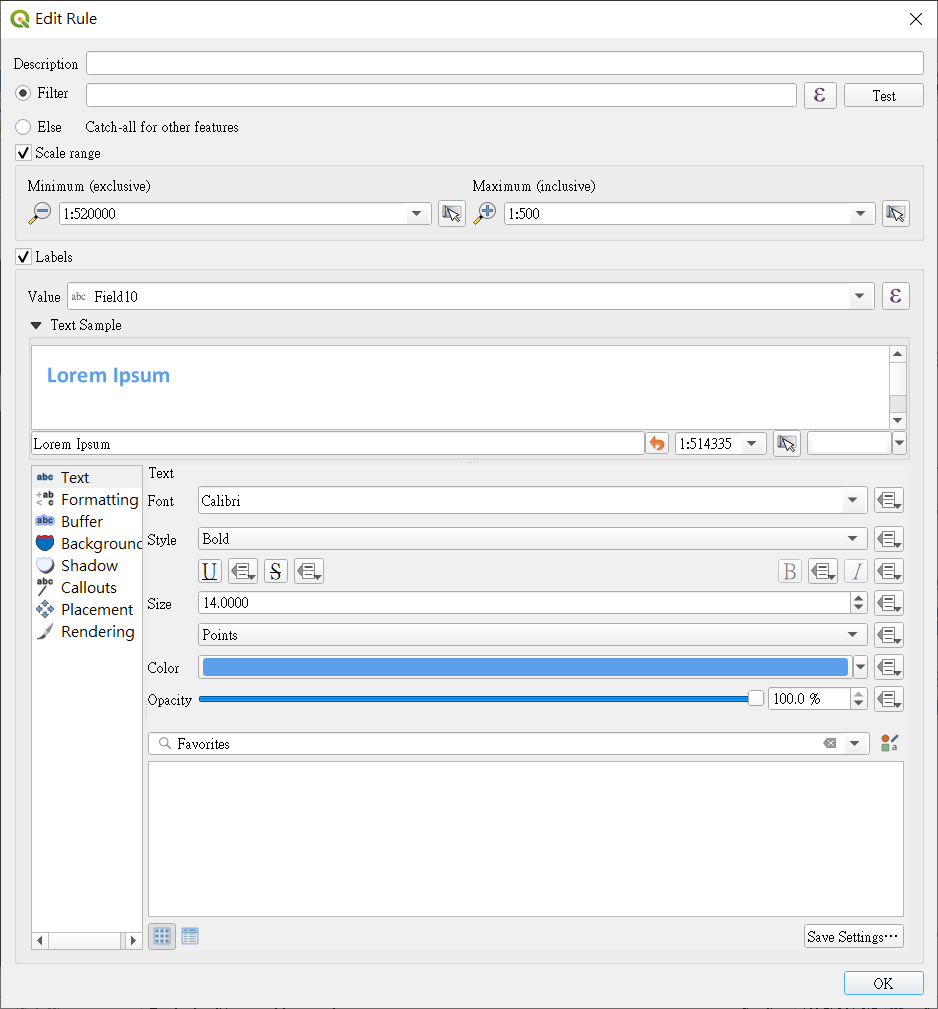
樣式設置完成後之示意圖: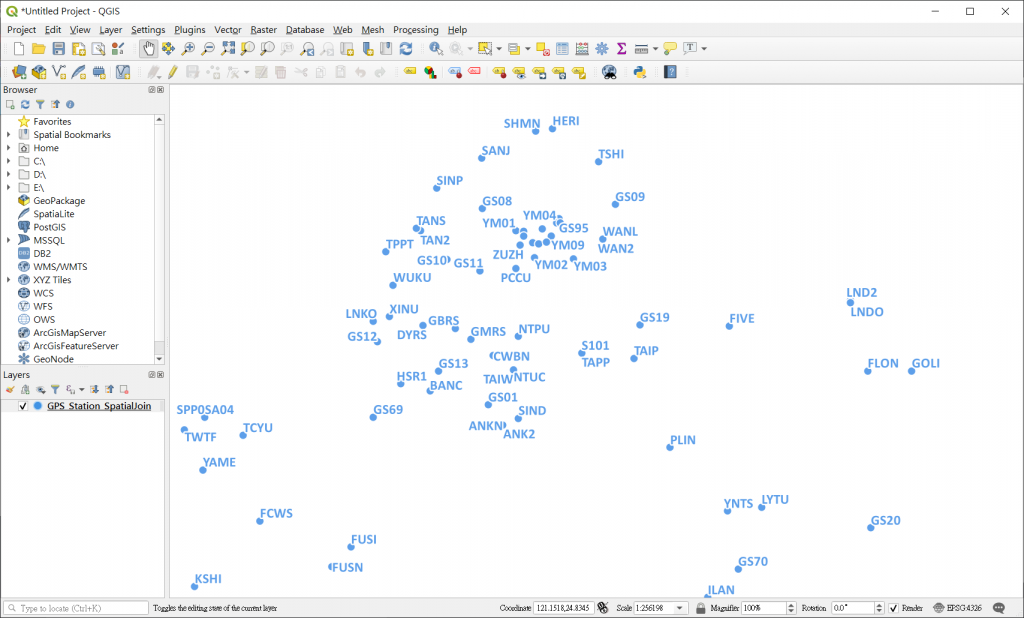
接著,根據 Day 05 發布 GPS_Station 地圖服務,介接網址如下:
介接示意圖: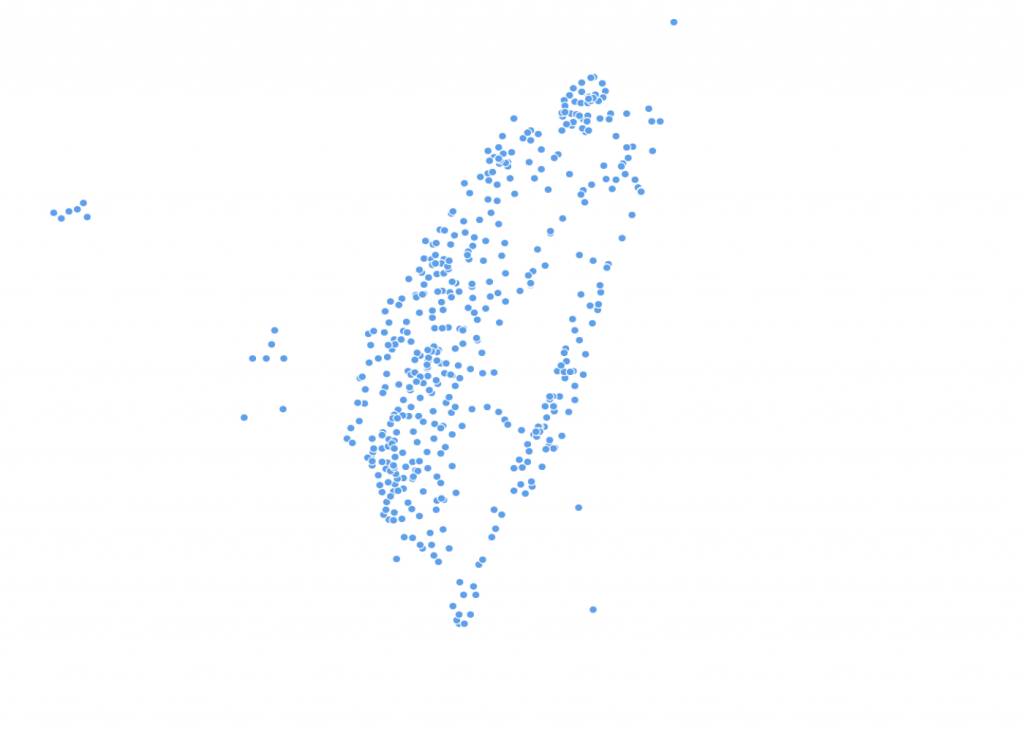
將更新後的所有GPS資料檔案放在 OLMapAPI 裡的Data/GPS_Station 內,方便存取。
STEP1. 先設定 Web.config 裡的內容,將GPS_Station的路徑給予 gpsPath 參數。
<add name="gpsPath" connectionString="OLMapAPI的路徑\\Data\\GPS_Station\" />
後續更新:這邊應該加到 appSettings 的 key 才對,當時加錯地方
STEP2. 建立 Model Class
Keyword:關鍵字輸入。GPSInputData:測站資料輸入。GPSDataList:GPS測站資料內容輸出。GPSStationList:GPS測站列表。public class Keyword
{
public string keyword { get; set; } //關鍵字
}
// input資料-測站輸入
public class GPSInputData
{
public string sdate { get; set; } //開始時間
public string edate { get; set; } //結束時間
public string gpsid { get; set; } //結束時間
}
/// <summary>
/// GPS測站資料內容
/// </summary>
public class GPSDataList
{
public string year { get; set; }
public string lat { get; set; }
public string lon { get; set; }
public string hgt { get; set; }
public string dN { get; set; }
public string dE { get; set; }
public string dU { get; set; }
}
/// <summary>
/// GPS測站列表
/// </summary>
public class GPSStationList
{
public string gpsid { get; set; }
public string sdate { get; set; }
public string edate { get; set; }
public string lat { get; set; }
public string lon { get; set; }
public string distance { get; set; }
}
STEP3. 建立 Infrastructure裡的function
在 BasicInfoFunc.cs 下新增幾個函式:
getGPSList:取得GPS測站列表(可輸入縣市)。getGPSbyID:利用GPS ID取得歷史時序性資料。/// <summary>
/// 獲取GPS測站列表
/// </summary>
public static async Task<List<GPSStationList>> getGPSList(Keyword keyword)
{
List<GPSStationList> GPSStationList = new List<GPSStationList>();
string SqlStr;
if (keyword.keyword == "*")
{
SqlStr = @"SELECT Station, sdate ,edate, lon, lat FROM [OLDemo].[dbo].[GPS_STATION] order by Station";
}
else
{
SqlStr = @"SELECT Station, sdate ,edate, lon, lat FROM [OLDemo].[dbo].[GPS_STATION] where County='" + keyword.keyword + "' order by Station";
}
SqlConnection conn = new SqlConnection(ConfigurationManager.ConnectionStrings["DefaultConnection"].ConnectionString);
SqlCommand cmd = new SqlCommand(SqlStr, conn);
conn.Open();
SqlDataReader dr = cmd.ExecuteReader();
while (dr.Read())
{
GPSStationList GPSStation = new GPSStationList();
GPSStation.gpsid = dr["Station"].ToString();
GPSStation.sdate = dr["sdate"].ToString();
GPSStation.edate = dr["edate"].ToString();
GPSStation.lon = dr["lon"].ToString();
GPSStation.lat = dr["lat"].ToString();
GPSStationList.Add(GPSStation);
}
dr.Close(); dr.Dispose(); conn.Close(); conn.Dispose();
return GPSStationList;
}
/// <summary>
/// 獲取GPS測站歷史資料列表
/// </summary>
public static async Task<List<GPSDataList>> getGPSbyID(GPSInputData parms)
{
String line;
List<GPSDataList> GPSData = new List<GPSDataList>();
try
{
string gpsPath = ConfigurationManager.ConnectionStrings["gpsPath"].ConnectionString;
StreamReader sr = new StreamReader(gpsPath + parms.gpsid + ".COR");
//Read the first line of text
line = sr.ReadLine();
Int32 count = 0;
float starthgt = 0;
float startn = 0;
float starte = 0;
//Continue to read until you reach end of file
while (line != null)
{
line = sr.ReadLine();
line = new System.Text.RegularExpressions.Regex("[\\s]+").Replace(line, " ");
char[] delimiterChars = { ' ', '\t' };
string[] words = line.Split(delimiterChars);
if (Int32.Parse(words[0]) >= Int32.Parse(parms.sdate) && Int32.Parse(words[0]) <= Int32.Parse(parms.edate))
{
GPSDataList GPS = new GPSDataList();
if (count == 0)
{
starthgt = float.Parse(words[3]);
startn = float.Parse(words[4]);
starte = float.Parse(words[5]);
}
float calhgt = (float.Parse(words[3]) - starthgt) * 1000;
float caln = (float.Parse(words[4]) - startn);
float cale = (float.Parse(words[5]) - starte);
GPS.year = words[0];
GPS.lat = words[1];
GPS.lon = words[2];
GPS.hgt = calhgt.ToString();
GPS.dN = caln.ToString();
GPS.dE = cale.ToString();
GPS.dU = words[6];
GPSData.Add(GPS);
count++;
}
}
//close the file
sr.Close();
Console.ReadLine();
}
catch (Exception r)
{
Console.WriteLine("Exception: " + r.Message);
}
finally
{
Console.WriteLine("Executing finally block.");
}
return GPSData;
}
STEP4. 建立 Controller
於 BasicController.cs 內新增兩個controller:
getGPSStationList()
getGPSDataList()
/// <summary>
/// 獲取GPS測站列表
/// </summary>
/// <returns></returns>
[Route("getGPSStationList")]
[HttpPost]
[SwaggerResponse(HttpStatusCode.OK, "OK", typeof(List<GPSStationList>))]
public async Task<HttpResponseMessage> getGPSStationList(Keyword keyword)
{
    try
    {
        return Request.CreateResponse(HttpStatusCode.OK, await BasicInfoFunc.getGPSList(keyword));
    }
    catch (Exception SqlException)
    {
        return Request.CreateResponse(HttpStatusCode.InternalServerError, "Internal Server Error");
    }
}

/// <summary>
/// 得到GPS測站歷史資料列表
/// </summary>
/// <returns></returns>
[Route("getGPSDataList")]
[HttpPost]
[SwaggerResponse(HttpStatusCode.OK, "OK", typeof(List<GPSDataList>))]
public async Task<HttpResponseMessage> getGPSDataList(GPSInputData parms)
{
    try
    {
        return Request.CreateResponse(HttpStatusCode.OK, await BasicInfoFunc.getGPSbyID(parms));
    }
    catch (Exception SqlException)
    {
        return Request.CreateResponse(HttpStatusCode.InternalServerError, "Internal Server Error");
    }
}
以上完成了DB端與後端的資料,接下來就要把前端的資料補上。
本次要使用的圖表為Highcharts.js,請下載 Highcharts.js,建立 GPS.html 頁面並引入需要的javascript檔。
預計畫面為:
<!DOCTYPE html>
<html>
<head>
    <meta charset="utf-8" />
    <title></title>
    <style>
        #GPSseg tr {
            height: 50px;
        }
    </style>
</head>
<body>
    <h2>GPS三維形變查詢</h2>
    <div>
        <div id="GPSseg" class="ui segment">
            <table style="width:100%;">
                <tbody>
                    <tr>
                        <td colspan="2">
                            <div class="ui toggle checkbox" id="GPSLyrCB">
                                <input type="checkbox" name="GPSLyr">
                                <label>GPS測站圖層</label>
                            </div>
                        </td>
                    </tr>
                    <tr>
                        <td style="width:75px;">縣市</td>
                        <td>
                            <select class="ui fluid dropdown" id="GPS_county">
                                <option value="*" selected>全部</option>
                                <option value="臺北市">臺北市</option>
                                <option value="新北市">新北市</option>
                                <option value="基隆市">基隆市</option>
                                <option value="桃園市">桃園市</option>
                                <option value="新竹市">新竹市</option>
                                <option value="新竹縣">新竹縣</option>
                                <option value="苗栗縣">苗栗縣</option>
                                <option value="臺中市">臺中市</option>
                                <option value="彰化縣">彰化縣</option>
                                <option value="南投縣">南投縣</option>
                                <option value="雲林縣">雲林縣</option>
                                <option value="嘉義市">嘉義市</option>
                                <option value="嘉義縣">嘉義縣</option>
                                <option value="臺南市">臺南市</option>
                                <option value="高雄市">高雄市</option>
                                <option value="屏東縣">屏東縣</option>
                                <option value="宜蘭縣">宜蘭縣</option>
                                <option value="花蓮縣">花蓮縣</option>
                                <option value="臺東縣">臺東縣</option>
                                <option value="澎湖縣">澎湖縣</option>
                                <option value="金門縣">金門縣</option>
                                <option value="連江縣">連江縣</option>
                            </select>
                        </td>
                    </tr>
                    <tr>
                        <td>GPS測站</td>
                        <td>
                            <select class="ui fluid dropdown search selection" id="gps_station">
                                <option value="" disabled selected>請選擇GPS測站</option>
                            </select>
                        </td>
                    </tr>
                    <tr>
                        <td>開始時間</td>
                        <td>
                            <div class="ui input">
                                <input type="text" id="startdate" class="datepick" disabled>
                            </div>
                        </td>
                    </tr>
                    <tr>
                        <td>結束時間</td>
                        <td>
                            <div class="ui input">
                                <input type="text" id="enddate" class="datepick" disabled>
                            </div>
                        </td>
                    </tr>
                    <tr>
                        <td colspan="2">
                            <div class="ListOptions" style="">
                                <input type="button" class="ui primary button fluid disabled" value="查詢" onclick="GPS.QueryGPS()">
                            </div>
                        </td>
                    </tr>
                </tbody>
            </table>
            <div style="font-size:14px;color:red;">*本網站GPS資料由<a href="http://gps.earth.sinica.edu.tw/" target="_blank">中央研究院地球科學研究所</a>提供</div>
        </div>
        <div>查詢結果:<span id="gps_result"></span></div>
        <div class="ui segment gpsresult" style="display:none;" id="gps_container"></div>
        <div class="ui segment gpsresult" style="display:none;" id="gps_containerN"></div>
        <div class="ui segment gpsresult" style="display:none;" id="gps_containerE"></div>
    </div>
    <script type="text/javascript" src="js/Plug_in/highcharts.js"></script>
    <script type="text/javascript" src="map_module/widget/ExpertModule/jGPS.js"></script>
    <script>
        $('.ui.dropdown').dropdown();
        GPS.mapGPSInit();
    </script>
</body>
</html>
畫面示意圖: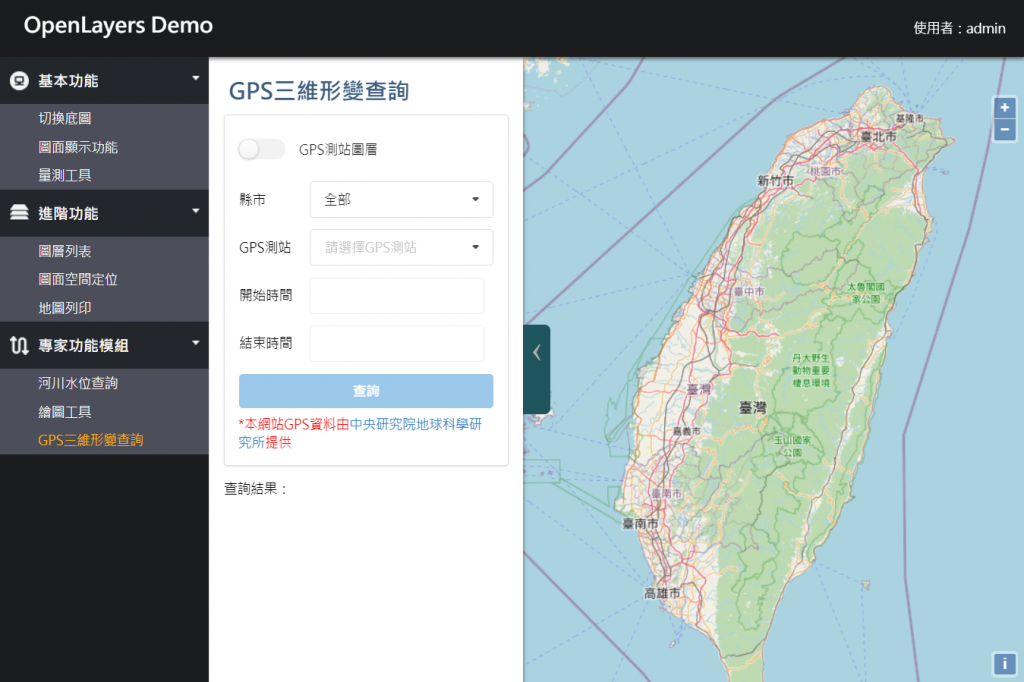
接著建立jGPS.js,將GPS相關的資料寫入。
由上述HTML檔可知頁面一載入即會執行 GPS.mapGPSInit()。
mapGPSInit() 首先先判斷Layer是否存在而影響圖層的開關狀態,並且設置開關的執行動作;接著介接getGPSStationList() 撈出所有測站代碼展示在第二個Dropdown內。
建立 GPS_county 變更監聽事件,當選擇縣市則重新撈取符合的GPS測站資料。
建立 gps_station 選擇監聽事件,當選擇任一個測站時,自動撈出起訖填入 開始與結束日期,並設計超過這個區間的值不給輸入。
var GPS = function () {
    var GPSStationList;
    var GPSDateList = [];
    var GPSData_hgt = [];
    var GPSData_dn = [];
    var GPSData_de = [];
    var FitGPSData_hgt = [];

    function mapGPSInit() {
        if (map.e_getLayer("GPSLyr") !== undefined) {
            $('#GPSLyrCB.checkbox').checkbox("set checked");
        }
        $('#GPSLyrCB.checkbox')
            .checkbox({
                onChecked: function () {
                    loadlayer();
                },
                onUnchecked: function () {
                    map.removeLayer(map.e_getLayer("GPSLyr"));
                }
            });
        // 產生GPS測站列表
        $.ajax({
            type: "POST",
            url: config_OLMapWebAPI + "/Basic/getGPSStationList",
            headers: {
                "Authorization": localStorage["token"]
            },
            contentType: 'application/json; charset=utf-8',
            dataType: 'json',
            data: JSON.stringify({
                "keyword": '*'
            }),
            success: function (data) {
                $('#gps_station')
                    .find('option')
                    .remove()
                    .end()
                    .append('<option value="" disabled selected>請選擇GPS測站</option>');
                for (var i = 0; i < data.length; i++) {
                    $('#gps_station').append(new Option(data[i].gpsid));
                }
                GPSStationList = data;
            }
        });

        $("#GPS_county").change(function () {
            var county = $("#GPS_county").val() === "全部" ? "*" : $("#GPS_county").val();
            // 產生GPS測站列表
            $.ajax({
                type: "POST",
                url: config_OLMapWebAPI + "/Basic/getGPSStationList",
                headers: {
                    "Authorization": localStorage["token"]
                },
                contentType: 'application/json; charset=utf-8',
                dataType: 'json',
                data: JSON.stringify({
                    "keyword": county,
                }),
                success: function (data) {
                    console.log(data);
                    $('#gps_station').siblings('.text').text('');
                    $('#gps_station')
                        .find('option')
                        .remove()
                        .end()
                        .append('<option value="choose_case" disabled selected>請選擇GPS測站</option>');
                    for (var i = 0; i < data.length; i++) {
                        $('#gps_station').append(new Option(data[i].gpsid));
                    }
                    $('#startdate').val('');
                    $('#enddate').val('');
                }
            });
        });

        $('#gps_station').on('change', function () {
            var id = $('#gps_station').find(":selected").text();
            var tmp = GPSStationList.filter(function (st) {
                return st.gpsid === id;
            });
            var GPS = tmp[0];
            proj4.defs("EPSG:3857", "+proj=merc +a=6378137 +b=6378137 +lat_ts=0.0 +lon_0=0.0 +x_0=0.0 +y_0=0 +k=1.0 +units=m +nadgrids=@null +wktext  +no_defs");
            proj4.defs('WGS84', "+proj=longlat +datum=WGS84 +no_defs ");
            var point = proj4("WGS84", "EPSG:3857", [parseFloat(GPS.lon), parseFloat(GPS.lat)]);
            console.log(point)
            map.e_centerAndZoom(new ol.Feature({
                geometry: new ol.geom.Point([point[0], point[1]])
            }), 5);
            $('.datepick').prop("disabled", false);
            $('.ListOptions input').removeClass("disabled");
            $('.datepick').datepicker("destroy");
            $('#startdate').datepicker({
                dateFormat: "yy-mm-dd",
                minDate: new Date(GPS.sdate.substring(0, 4), String(parseInt(GPS.sdate.substring(4, 6)) - 1), GPS.sdate.substring(6, 8)),
                maxDate: new Date(GPS.edate.substring(0, 4), String(parseInt(GPS.edate.substring(4, 6)) - 1), GPS.edate.substring(6, 8)),
                onSelect: function (dateText, inst) {
                    $('#startdate').val(dateText);
                }
            });
            $('#enddate').datepicker({
                dateFormat: "yy-mm-dd",
                minDate: new Date(GPS.sdate.substring(0, 4), String(parseInt(GPS.sdate.substring(4, 6)) - 1), GPS.sdate.substring(6, 8)),
                maxDate: new Date(GPS.edate.substring(0, 4), String(parseInt(GPS.edate.substring(4, 6)) - 1), GPS.edate.substring(6, 8)),
                onSelect: function (dateText, inst) {
                    $('#enddate').val(dateText);
                }
            });
            $('#startdate').datepicker('setDate', new Date(GPS.sdate.substring(0, 4), String(parseInt(GPS.sdate.substring(4, 6)) - 1), GPS.sdate.substring(6, 8)))
            $('#enddate').datepicker('setDate', new Date(GPS.edate.substring(0, 4), String(parseInt(GPS.edate.substring(4, 6)) - 1), GPS.edate.substring(6, 8)))
        });
    }

    return {
        mapGPSInit: mapGPSInit,
        QueryGPS: QueryGPS
    };
}();
介接前面自行發布的WMS服務,並展在圖台上
function loadlayer(item) {
    var source = new ol.source.TileWMS({
        url: 'http://localhost/qgis/wms?',
        params: {
            'map': 'GPS_Station.qgs',
            'LAYERS': 'GPS_Station',
            'TILED': true,
            'FORMAT': 'image/png',
            'VERSION': '1.1.1'
        },
        serverType: 'geoserver',
        // Countries have transparency, so do not fade tiles:
        transition: 0
    });
    var layer = new ol.layer.Tile({
        opacity: 1,
        source: source
    });
    layer.id = "GPSLyr";
    layer.setOpacity(1);

    if (map.e_getLayer("GPSLyr") === undefined) {
        map.addLayer(layer);
    } else {
        map.e_getLayer("GPSLyr").getSource().clear();
        map.e_getLayer("GPSLyr").setSource(source);
    }
}
服務接入後圖台示意圖: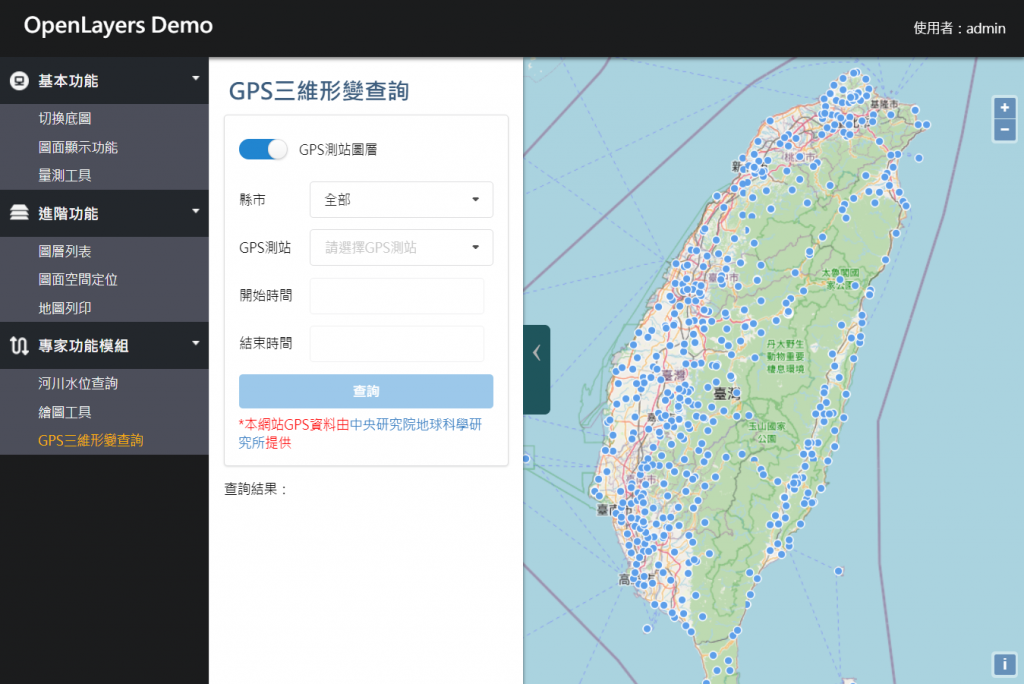
點選查詢按鈕後執行 QueryGPS() ,撈取輸入參數值並執行 runGPS() 函式。
function QueryGPS() {
    var Station = $('#gps_station').find(":selected").text();
    var Sdate = $('#startdate').val().replace(new RegExp('-', 'g'), '');
    var Edate = $('#enddate').val().replace(new RegExp('-', 'g'), '');
    runGPS(Station, Sdate, Edate, 'GPS')
}
runGPS() 函式即是介接 getGPSDataList() 的WebAPI,將每個資料存入區域變數當中。
由於GPS的資料 一天有一筆,直接看每天的數據較難以看出趨勢內容,因始要將每日GPS解算資料進行 擬合、處理 後展示,會較有其意義。
function runGPS(ID, sdate, edate, status) {
GPSDateList.length = 0;
GPSData_hgt.length = 0;
GPSData_dn.length = 0;
GPSData_de.length = 0;
$.ajax({
type: "POST",
url: config_OLMapWebAPI + "/Basic/getGPSDataList",
headers: {
"Authorization": localStorage["token"]
},
contentType: 'application/json; charset=utf-8',
dataType: 'json',
data: JSON.stringify({
"sdate": sdate,
"edate": edate,
"gpsid": ID,
}),
success: function (data) {
//console.log(data);
data.forEach(function (value) {
var oneday = [Date.UTC(parseInt(value.year.substring(0, 4)), parseInt(value.year.substring(4, 6)) - 1, parseInt(value.year.substring(6, 8))), parseFloat(parseFloat(value.hgt).toFixed(3))];
var onedayn = [Date.UTC(parseInt(value.year.substring(0, 4)), parseInt(value.year.substring(4, 6)) - 1, parseInt(value.year.substring(6, 8))), parseFloat(parseFloat(value.dN).toFixed(3))];
var onedaye = [Date.UTC(parseInt(value.year.substring(0, 4)), parseInt(value.year.substring(4, 6)) - 1, parseInt(value.year.substring(6, 8))), parseFloat(parseFloat(value.dE).toFixed(3))];
GPSData_hgt.push(oneday);
GPSData_dn.push(onedayn);
GPSData_de.push(onedaye);
GPSDateList.push(parseInt(value.year));
});
var parm = Math.floor(GPSDateList.length / 5);
if (parm > 30) {
parm = 31; //至少1個月1個值
}
var interval = parm;
if (parm % 2 === 1) {
interval = parm;
} else {
interval = parm + 1;
}
var fitdata = fit_moveaverage(GPSData_hgt, interval, 'center');
FitGPSData_hgt = fitdata;
drawGPS(ID, GPSData_hgt, fitdata, 'gps_container', 'GPS測站高程變化量');
var fitdata_n = fit_moveaverage(GPSData_dn, interval, 'center');
var fitdata_e = fit_moveaverage(GPSData_de, interval, 'center');
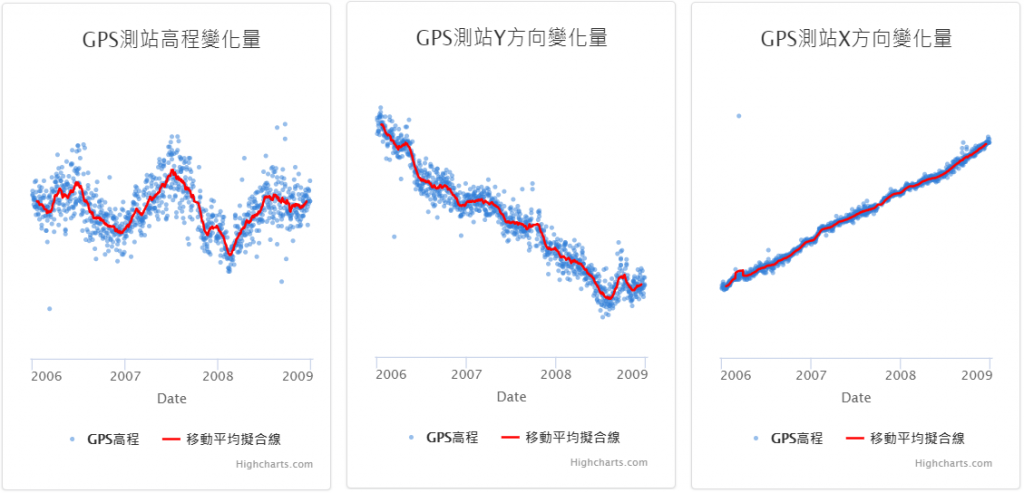
drawGPS(ID, GPSData_dn, fitdata_n, 'gps_containerN', 'GPS測站Y方向變化量');
drawGPS(ID, GPSData_de, fitdata_e, 'gps_containerE', 'GPS測站X方向變化量');
}
});
}
本次採用 移動平均 的算法來進行 趨勢線 的展示,移動平均的算法可分為取分界前面的數據、分界左右的數據、分界後面的數據 這幾種。
根據上面的程式碼,移動平均的計算方式以 中間 為範例:
function fit_moveaverage(data, interval, mode) {
    var half = Math.floor(interval / 2);
    var FitData = [];
    if (mode === 'center') {
        FitData.length = 0;
        data.forEach(function (value, idx) {
            if (idx >= half && idx < (data.length - half - 1)) {
                var sum = 0;
                for (i = idx - half; i <= idx + half; i++) {
                    sum += data[i][1];
                };
                FitData.push([value[0], sum / interval]);
            }
        });
    } else if (mode === 'front') {
        half = interval;
        FitData.length = 0;
        data.forEach(function (value, idx) {
            if (idx >= 0 && idx < (data.length - half - 1)) {
                var sum = 0;
                for (i = idx; i <= idx + half; i++) {
                    sum += data[i][1];
                };
                FitData.push([value[0], sum / interval]);
            }
        });
    } else {
        half = interval;
        FitData.length = 0;
        data.forEach(function (value, idx) {
            if (idx >= half && idx < (data.length - 1)) {
                var sum = 0;
                for (i = idx - half; i <= idx; i++) {
                    sum += data[i][1];
                };
                FitData.push([value[0], sum / interval]);
            }
        });
    }
    return FitData
}
drawGPS() 主要是將上述撈出與計算的資料,建立Highcharts.js圖表,於圖上顯示 原始的每日數據與 進行移動平均計算後得趨勢線 此兩者。
這邊隱藏y軸坐標軸是因為展示畫面的寬度太窄小,若再放進去圖幅會不夠。
function drawGPS(gpsid, data, fitdata, container, title) {
    var gpsstation = gpsid;
    var s_date = GPSDateList[0];
    var e_date = GPSDateList[GPSDateList.length - 1];
    $('#gps_result').html(gpsstation + ' (' + s_date + ' ~ ' + e_date + ')');
    $('#gps_container').show();
    $('#gps_containerN').show();
    $('#gps_containerE').show();
    //畫圖
    parent.Highcharts.chart(container, {
        title: {
            text: title
        },
        xAxis: {
            type: 'datetime',
            dateTimeLabelFormats: {
                day: '%m/%d',
                week: '%m/%d',
                month: '%Y-%m',
                year: '%Y'
            },
            title: {
                text: 'Date'
            }
        },
        yAxis: {
            gridLineColor: '#ababab',
            title: {
                text: '變化量(mm)'
            },
            labels: {
                formatter: function () {
                    return this.value;
                }
            },
            visible: false
        },
        tooltip: {
            crosshairs: true,
            shared: true
        },
        series: [{
            type: 'scatter',
            name: 'GPS高程',
            data: data,
            color: 'rgba(47, 126, 216, 0.50)',
            marker: {
                radius: 2
            },
            tooltip: {
                headerFormat: '<b>{series.name}</b><br>',
                pointFormat: '{point.x:%Y-%m-%d}: {point.y} mm'
            }
        }, {
            type: 'line',
            name: '移動平均擬合線',
            data: fitdata,
            color: 'rgba(255, 0, 0, 1)',
            marker: {
                enabled: false
            }, tooltip: {
                headerFormat: '<b>移動平均擬合線</b><br>',
                pointFormat: '{point.x:%Y-%m-%d}: {point.y:.3f} mm'
            }
        }]
    });
}
查詢畫面示意圖: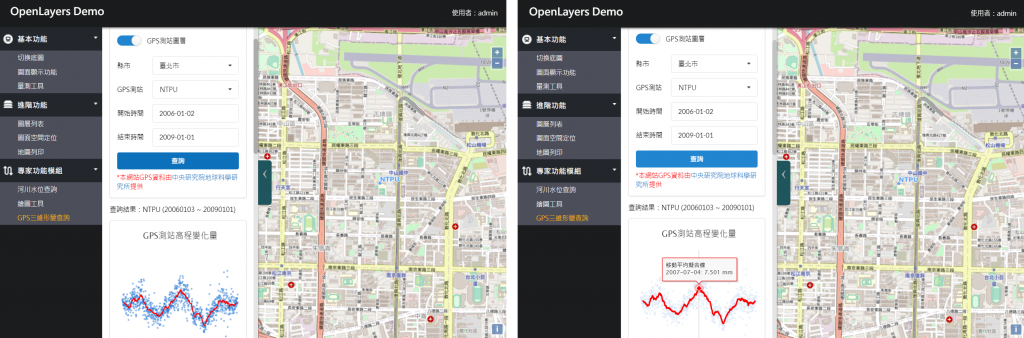
今天的內容有點多,快要到3w字的篇幅了,但我們學會了整體資料介接的流程了,算是複習了我們前面所學過的功能,除此之外還學會了如何套圖表套件,讓整體的網頁質感更升級。
鐵人賽終於也快進入尾聲了,既然我們圖台都已經大致上開發完成了,接下來我們要學怎麼讓地圖輸出、保留圖面資料的現況,也是本系列最後的一個功能!加油~加油~


 iThome鐵人賽