本來只想探討Pillow histogram在人臉辨識的運用,卻扯出了一堆疑問….
"圖片差異比對"真的是有智慧的嗎? Is骨齡Bone Age 判讀intelligent ?
某些臉部辨識程式碼會運用Pillow Image.histogram顏色直方圖的差異,difference數字愈大,表示兩張圖片愈不相同。現在先研究一下:
Question:
histogram() method returns a list of pixel counts for each band present in the image.
The list will have all the counts concatenated for each band.
If an image is of mode "RGB" then for each of band/color a list of pixel counts will be returned, totaling 768.
In other words, for an RGB image, the histogram() method gives information on how many kind of Red, Green and Blue pixels are present in the image for each 256 types of red, 256 types of green and 256 types of blue.
這段話的意思:
Pillow Image的’直方圖方法’,傳回的是各個顏色的”數量”。
傳回一個list(列表),list內各元素的數字就是該顏色在圖片中出現的次數。
如果是RGB圖片,可傳回三個histogram 代表R G B 三層各自256階出現的次數。
舉例來說:
Histogram() 是個list 長度768
print(f'type(picA.histogram()) : {type(picA.histogram())}')
type(picA.histogram()) : <class 'list'>
len(picA.histogram()): 768
把picA拆成三色
r1, g1, b1 = picA.split()
print(type(r1.histogram()))
把紅色前面5個色階的出現次數,印出來看看
print(r1.histogram()[:5])
[15, 2, 11, 13, 26] Red 色階0出現15次,色階1出現2次,色階2出現11次….
【如何測試本程式】 Source code download
1.選一張圖,當原尺寸 arrowA.jpg,另製作一張縮小成一半大小arrowB.jpg
2.可以切換兩種方式(原尺寸、相同尺寸),試看看效果如何
標註程式碼,切換試試看
# 可以切換兩種方式(原尺寸、相同尺寸),試看看效果如何
# 調整成相同尺寸
picA, picB = imgResize(pic1,pic2)

# 依原始尺寸,不調整
#picA = pic1
#picB = pic2
3.了解觀察histogram
print(f'type(picA.histogram()) : {type(picA.histogram())}')
print(f'len(picA.histogram()): {len(picA.histogram())}')
print(r1.histogram()[:5])
print(len(r1.histogram()))
4.我們來看看picA的histogram 長得像什麼
借用一張圖 
#--- plot bar chart of picA.histogram
x = np.arange(0,256)
# 畫出 picA 三色 histogram
plt.title('picA histogram')
plt.bar(x, r1list,color='red')      #紅
plt.bar(x,g1list,color='green')     #綠
plt.bar(x,b1list,color='blue')      #藍
plt.show()
發現此圖出現次數多的都偏重在RGB的前面100個色階,代表這張圖偏深色調。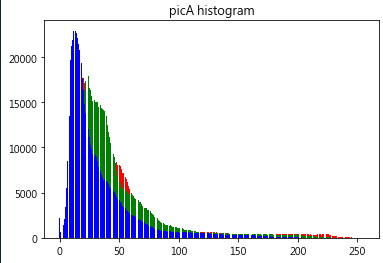
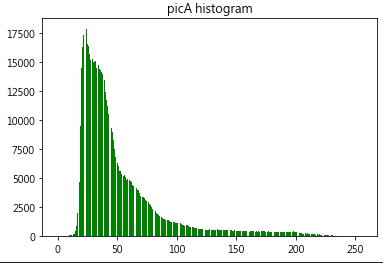
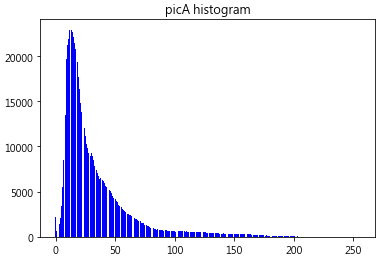
三色分開來看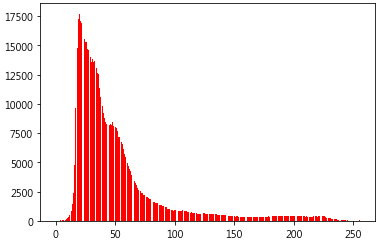
5. 比較兩張圖片的histogram差異Histogram difference method:
兩種計算方式:
第一種【直接相減】
#--- 兩圖RGB出現次數"直接相減"的簡單評估方法
#--- 計算 某一色階出現次數/此圖該色階出現次數平均值 之 比例%
#--- red scale
r1Avg = np.mean(r1list)
print(f'r1Avg {r1Avg}')
rr1 = []
for i in range(len(r1list)):
    rr1.append(100*r1list[i] / r1Avg)
#print('rr1[:10]',rr1[:10])
rr2 = []
r2Avg = np.mean(r2list)
print(f'r2Avg {r2Avg}')
for j in range(len(r2list)):
    rr2.append(100*r2list[j] / r2Avg)
rrD = []                          # 兩圖紅色差異
for j in range(len(r2list)):
    rrD.append(abs(rr1[j]-rr2[j]))
#print('rrD different % : ',rrD[:10])

#--- 以下略...
第二種【平方根複雜計算式】
顏色在圖片中出現次數的不同,差異臨界點100以內的,認定是”無差異的”。
#--- 平方根的複雜計算式
def DiffSqrt(pic1,pic2):
    h1 = pic1.histogram()
    h2 = pic2.histogram()
    diff = math.sqrt(reduce(operator.add,
                     list(map(lambda a,b: (a-b)**2, h1, h2)))/len(h1))
    '''上一行意思: h1 h2相減-->平方-->平均-->再....-->再開平方根...
    '''
    # threshold 100,如果diff<=100,認定無差異
    if(diff <= 100):
        tmp = '兩張圖片 無差異'
    else:
        tmp = '兩張圖片 不相同'
    print(f'{tmp}  diff = :  {diff}')
結果:
''' 兩種方法測試結論:
內容相同的一張圖,一張原尺寸 & 一張縮小成一半
切換【原尺寸】或【縮成相同尺寸】兩種狀況下
直接相減法 : 結論相同
平方根算法:結論不同
'''
衍生出來的疑問是:
心存這樣的疑惑,我上網去測試
2017年RSNA Radiology Society of North America舉辦的Bone Age Challenge
如果,拿一張主辦單位提供的資料庫X光片測試,就會給出一個完美的骨齡判讀結果。
(註:男女孩骨頭發育時程不同,所以切換選男女)。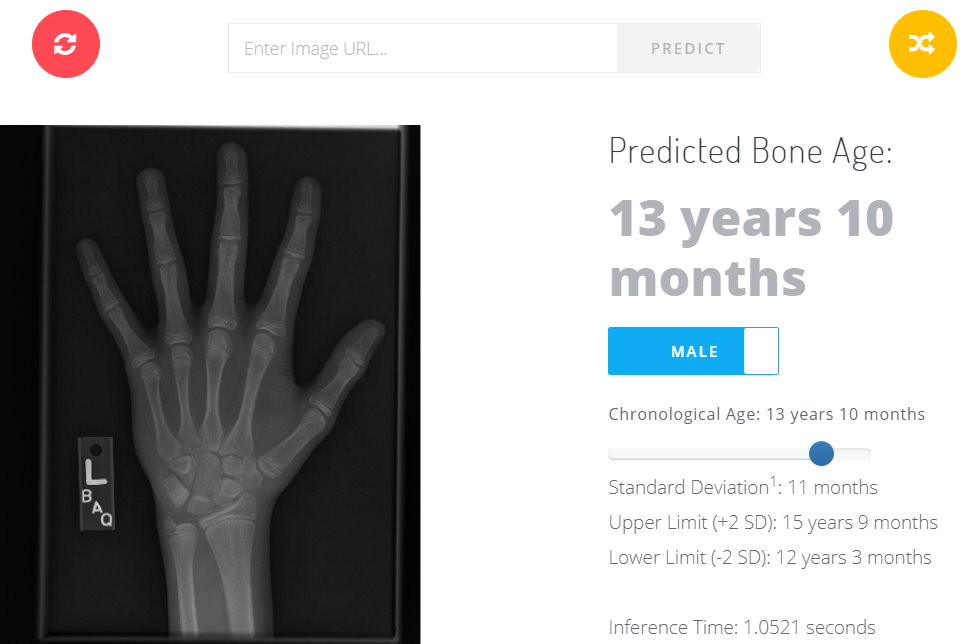
出於疑惑心態,我給它一張Lenna.jpg ,它也能判讀,也給我一個骨齡結果。傻眼?
Why is that? 它內部真正的比對算法是?
也是RGB? 不過它已先轉成GrayScale了,而且提供training的也是PNG檔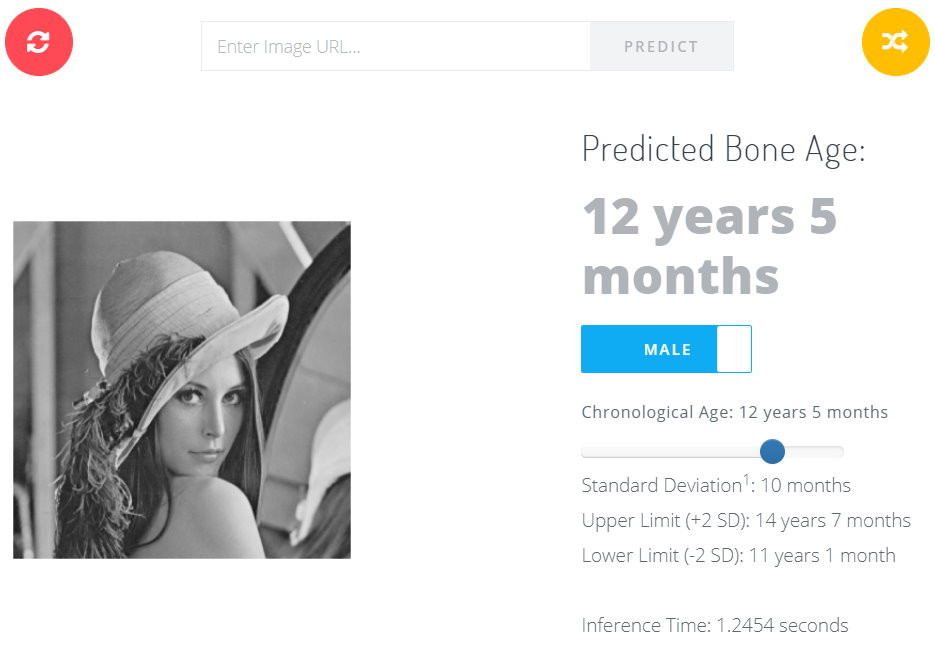
關於Bone Age 後續研究中….
臉部辨識也可以研究一下,最近出現的Intel OpenVINO ….
 neocaffe
