在進行訓練的過程中,我們可能因為某些關係而中斷訓練,可能是網路斷線或是電腦斷電等問題,這時候我們可以用以下指令重新開始訓練,簡單來說就是把原先 darknet53.conv.74 的權重,換成最新一個訓練權重結果,而後面是記錄整個訓練過程的紀錄檔,因為是用 -a 選項,所以也是會繼續附加上去。
cd /home/ec2-user/fishRecognition/fishsite/FishRecognition
../darknet/darknet detector train cfg/obj.data cfg/yolov3.cfg weights/yolov3.backup | tee -a trainRecord.txt
最終,我們訓練了 6 千多次,大約花了 5 個小時,因為晚上訓練了一段時間,隔天早上又接著訓練,所以沒有記錄確切時間。最終平均損失值約為 0.26 左右,已經是已經是官方允可的範圍 (0.05 ~ 3)內。接著要進行測試,看看訓練結果如何,測試圖片時需要有 data 這個目錄,似乎是因為辨識完成後畫圖時需要有些圖片在這個目錄內,所以需要把這個目錄建立一個鏈結到目前的目錄裡
ln -s ../darknet/data .
# 利用訓練後的權重來進行模型測試
../darknet/darknet detector test cfg/obj.data cfg/yolov3.cfg weights/yolov3.backup ./labels/02-frame-608x608-0090.jpg
../darknet/darknet detector test cfg/obj.data cfg/yolov3.cfg weights/yolov3.backup ./labels/00-frame-608x608-0030.jpg
../darknet/darknet detector test cfg/obj.data cfg/yolov3.cfg weights/yolov3.backup ./labels/01-frame-608x608-0030.jpg
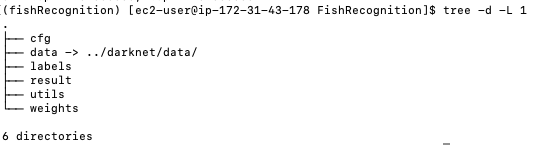
圖 1、辨識魚類目錄的結構
測試後的輸出結果,結果非常準確,照片中所有的魚都有找到,且置信度很高。
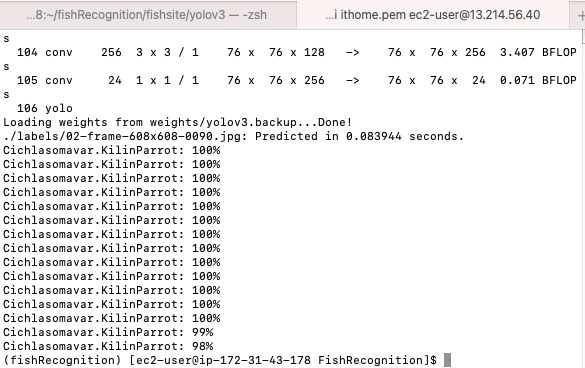
圖 2、測試的輸出結果
下圖是針對 3 種觀賞魚來進行辨識的結果,辨識時間很短,也都能準確找出來。
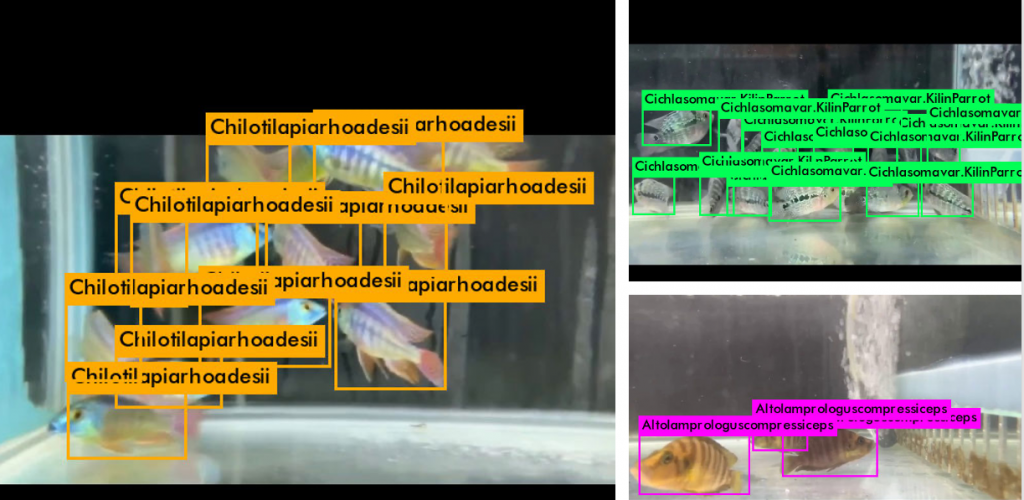
圖 3、針對 3 種觀賞魚分別測試的結果
對於這樣的結果很滿意,但是主要的原因是樣本數太少,且太相近,因為是從同一個影片擷取出來的,但只能說本次專案的目標本來就不在提供一個精準的結果,而是展示一個過程,以及展示一個全端架構,每一個部分都可以進行修改跟優化。以下內容是觀察整個訓練過程,觀察平均損失的變化以及 IoU (交集與聯集比,Intersection over Union),簡單來說平均損失可以視為猜錯的量,數值越大表示模型越不準;IoU 是指模型所找出的方塊框,與物件所在的方塊框,如果等於 1,那就表示模型找到的方塊框與物件所在的方塊框完全重疊,就算是沒有,也希望越大越好,當然,範圍就是介於 0-1 之間,下圖就是 IoU 的示意圖,可以想像 A 方塊框就是物件所在方塊,B 方塊框是模型猜測方塊。
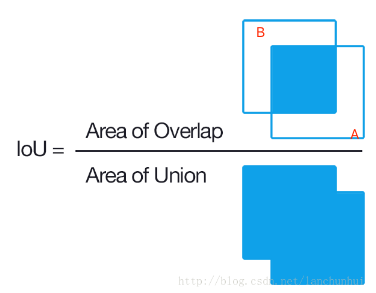
圖 4、IoU 的示意圖
以下三隻程式的目的是要分析訓驗記錄檔,並將結果以圖形方式呈現:
extract_log.py
#!/usr/bin/python
#coding=utf-8
import inspect
import os
import random
import sys
def extract_log(log_file, new_log_file, key_word):
    with open(log_file, 'r') as f:
        with open(new_log_file, 'w') as train_log:
            for line in f:
                #去除多 GPU 的同步記錄;去除除零錯誤的記錄
                if ('Syncing' in line) or ('nan' in line):
                    continue
                if key_word in line:
                    train_log.write(line)
    f.close()
    train_log.close()

extract_log('trainRecord.txt', 'train_log_loss.txt', 'images')
extract_log('trainRecord.txt', 'train_log_iou.txt', 'IOU')
下圖就是 YOLOV3 訓練時的紀錄檔 (trainRecord.txt),上面的程式就是依照關鍵字 images 來形成 train_log_loss.txt 文檔; IOU 來形成 train_log_iou.txt。
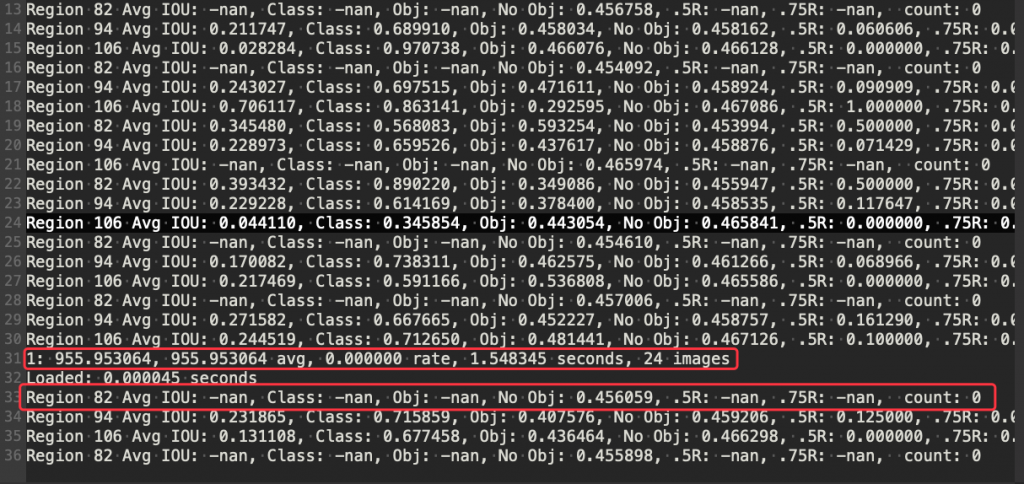
圖 5、YOLOV3 訓練時的紀錄檔
下圖是每次疊代損失的文字記錄檔 train_log_loss.txt,共 6298 行。
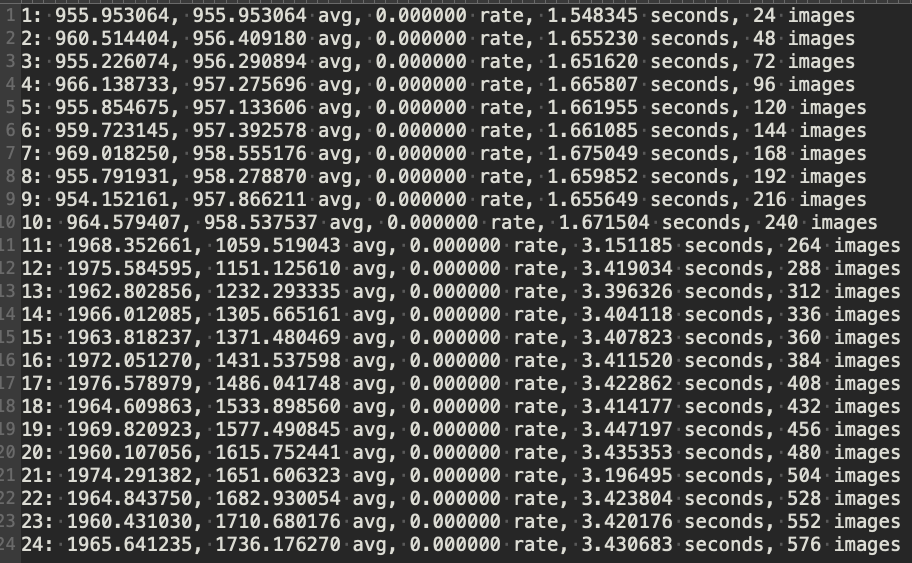
圖 6、每次疊代損失的文字記錄檔
下圖是優化 IoU 的文字記錄檔 train_log_iou.txt ,共 106451 行。
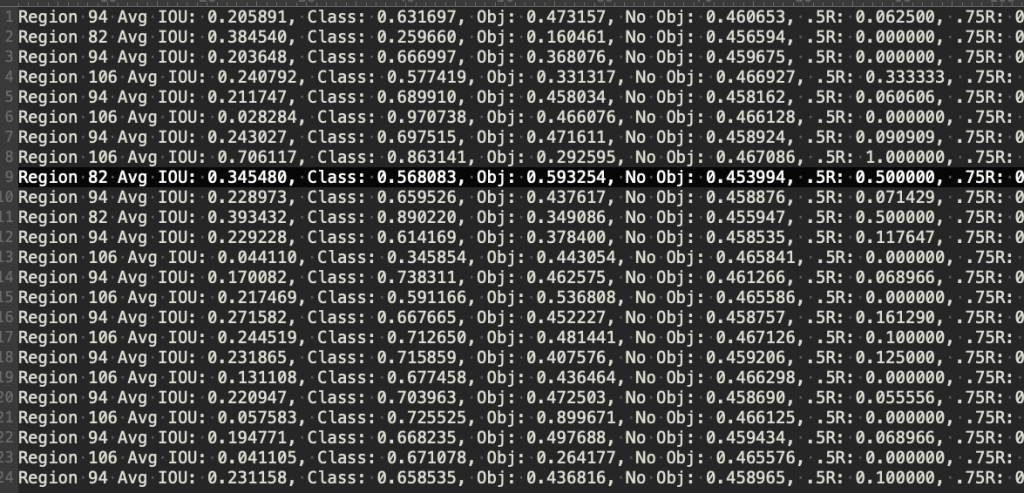
圖 7、優化 IoU 的文字記錄檔
train_iou_visualization.py
#!/usr/bin/python
#coding=utf-8

import pandas as pd
import numpy as np
import matplotlib.pyplot as plt

#根據自己的 log_loss.txt 中的行數修改 lines, 修改訓練時的疊代起始次數 (start_ite) 和结束次数 (end_ite)。
lines = 6331
start_ite = 1 #log_loss.txt 裡面的最小疊代次數
end_ite = 6298 #log_loss.txt裡面的最大疊代次數
step = 30 # 跳行數,決定畫圖的稠密程度
igore = 0 # 當開始的 loss 較大時,你需要忽略前 igore 次疊代,注意這裡是疊代次數

y_ticks = [1, 100, 200, 300, 500, 800] #縱坐標的值,可以自己設置。
data_path =  'train_log_loss.txt' #log_loss的路徑。

####-只需要改上面的,下面的可以不改動
names = ['loss', 'avg', 'rate', 'seconds', 'images']
result = pd.read_csv(data_path, skiprows=[x for x in range(lines) if (x<lines*1.0/((end_ite - start_ite)*1.0)*igore or x%step!=9)], error_bad_lines=\
False, names=names)
result.head()
for name in names:
    result[name] = result[name].str.split(' ').str.get(1)

result.head()
result.tail()

for name in names:
    result[name] = pd.to_numeric(result[name])
result.dtypes
print(result['loss'].values)

fig = plt.figure()
ax = fig.add_subplot(1, 1, 1)

x_num = len(result['loss'].values)
tmp = (end_ite-start_ite - igore)/(x_num*1.0)
x = []
for i in range(x_num):
    x.append(i*tmp + start_ite + igore)
#print(x)
print('total = %d\n' %x_num)
print('start = %d, end = %d\n' %(x[0], x[-1]))

ax.plot(x, result['loss'].values, label='avg_loss')
#ax.plot(result['loss'].values, label='loss')
plt.yticks(y_ticks)
plt.grid()
ax.legend(loc = 'best')
ax.set_title('The loss curves')
ax.set_xlabel('batches')
fig.savefig('loss')
下圖中顯示平均損失數量收斂的很快,在前200多次的疊代中就收斂 1 左右。
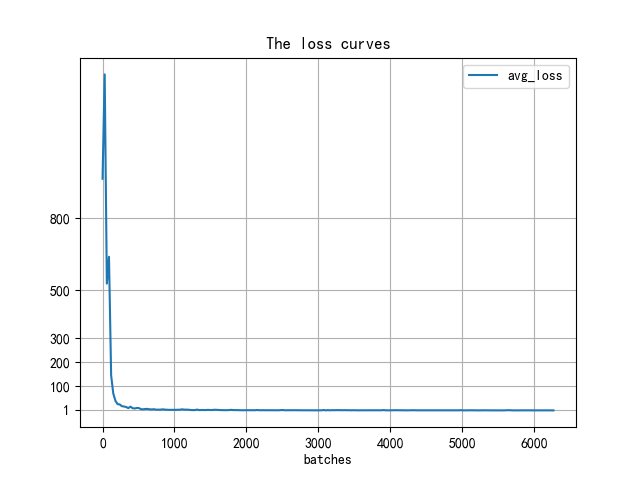
圖 8、訓練過程的平均損失變化
當我們忽略前 1000 次的疊代時,得到下圖,可以發現訓練過程中是有發生震盪的
igore = 1000 # 當開始的 loss 較大時,你需要忽略前 igore 次疊代,注意這裡是疊代次數
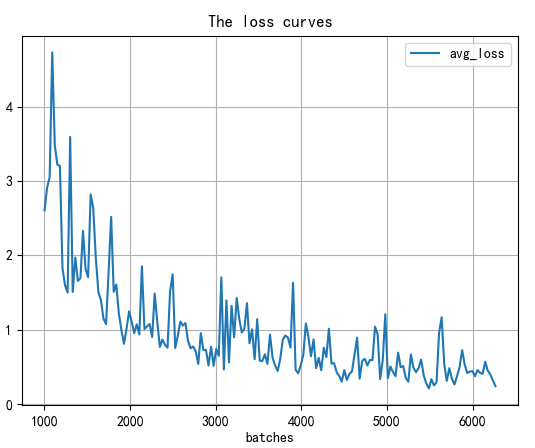
圖 9、訓練過程2000次後的平均損失變化
train_loss_visualization.py
#!/usr/bin/python
#coding=utf-8

import pandas as pd
import numpy as np
import matplotlib.pyplot as plt

#根據log_iou修改行數
lines = 106451
step = 5000
start_ite = 100
end_ite = 10000
igore = 100
data_path =  'train_log_iou.txt' #log_loss的路徑。

names = ['Region Avg IOU', 'Class', 'Obj', 'No Obj', '.5_Recall', '.7_Recall', 'count']
#result = pd.read_csv('log_iou.txt', skiprows=[x for x in range(lines) if (x%10==0 or x%10==9)]\
result = pd.read_csv(data_path, skiprows=[x for x in range(lines) if (x<lines*1.0/((end_ite - start_ite)*1.0)*igore or x%step!=0)]\
, error_bad_lines=False, names=names)
result.head()

for name in names:
    result[name] = result[name].str.split(': ').str.get(1)
result.head()
result.tail()
for name in names:
    result[name] = pd.to_numeric(result[name])
result.dtypes


####--------------
x_num = len(result['Region Avg IOU'].values)
tmp = (end_ite-start_ite - igore)/(x_num*1.0)
x = []
for i in range(x_num):
	x.append(i*tmp + start_ite + igore)
#print(x)
print('total = %d\n' %x_num)
print('start = %d, end = %d\n' %(x[0], x[-1]))
####-------------


fig = plt.figure()
ax = fig.add_subplot(1,1,1)
ax.plot(x, result['Region Avg IOU'].values, label='Region Avg IOU')
#ax.plot(result['Avg Recall'].values, label='Avg Recall')
plt.grid()
ax.legend(loc='best')
ax.set_title('The Region Avg IOU curves')
ax.set_xlabel('batches')
fig.savefig('iou')
下圖顯示的是 iou 的變化情形
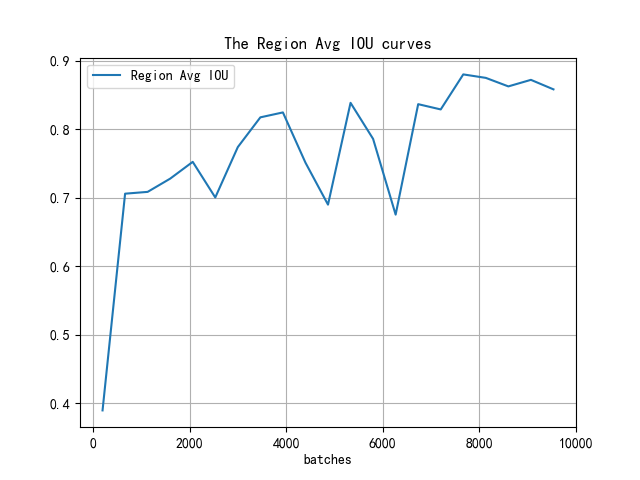
圖 10、訓練過程中 IoU 的變化


 iThome鐵人賽