本篇大綱:Force 原理、引力與斥力、五種作用力、Force的 API 們、六種應用範例
今天要來講講 Force 原力~這是我認為D3中數一數二困難的圖表繪製方法,這類的方法主要是用來繪製下方這種力導向圖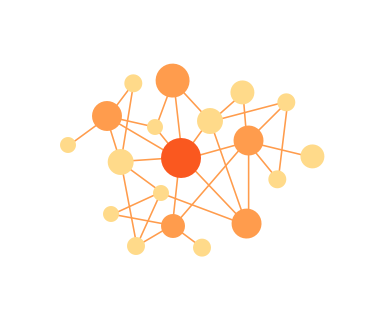
力導向圖可以應用在物理模擬、資料關係圖、拓撲圖的繪製,雖然這些不算是很常見的圖表,但用途也是蠻廣的~
知道Force方法的用途後,現在我們來講講它的原理吧!探討Froce的原理之前,我們先來說說什麼是 velocity Verlet (韋爾萊積分法)。韋爾萊積分法是牛頓力學中的一種積分方法,用來求解牛頓運動方程的數值方法,在力學模擬的運用中非常普遍。上面這段話聽起來跟普通人的距離似乎很遠,讓我換個方式講解~大家有沒有玩過瑪利歐兄弟、楓之谷、憤怒鳥、英雄聯盟等等任何遊戲呢?在這些遊戲中,你是不是能操作自己的角色前進後退、跳上跳下、彈射打小豬呢?這些角色移動的過程、角色的位置、移動方向、是否會其他物體重疊碰撞等等的計算,靠的就是以牛頓力學理論為基礎去運算,而我們的 D3 Force 一樣也是運用了韋爾萊積分法模擬粒子物理運動的原理來繪製力導向圖。
使用 D3 的 Force時,一開始會先把所有的元素設定任意的初始值配置,接著套用一些設定,再讓元素依照這些設定去移動,這些移動就是模擬粒子物理運動的原理。
當我們使用 d3.forceSimulation( ) 方法建立力模擬器後,力模擬器會模擬粒子運作的方式,把畫面上的DOM元素們視為一個個的節點,這些節點彼此有斥力,而整體則是有引力牽引。隨著程式的運行,節點會在各種力的交互作用、碰撞聚攏下,逐漸收斂到一個穩定位置。這些節點收斂的方式是使用一個叫 alpha 的參數去控制,透過d3提供的API可以控制alpha的遞減速度來改變力模擬圖收斂的速度;除此之外,還能設定節點的摩擦係數去調整收斂的速度,至於有哪些 API 我們晚點會一一講解。
設定完力模擬器並綁定到節點上後,模擬器會對每個節點建立以下成員
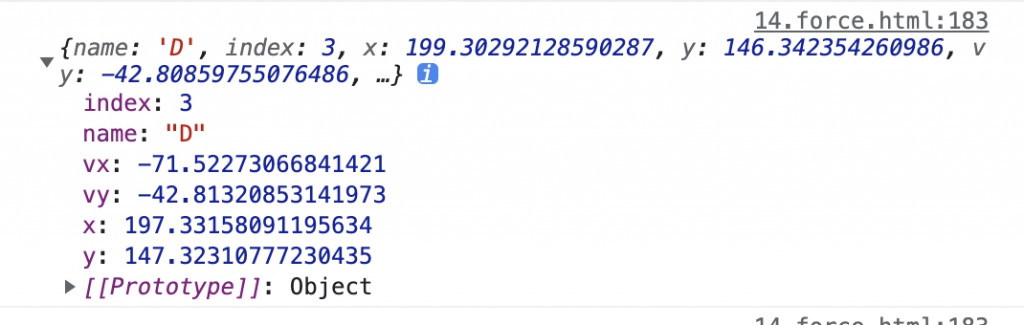
之後我們就能將這些位置的資料重新賦予給node節點,讓節點調整到對應的位置
除了引力跟斥力之外,力導向圖還可以透過另外這五種作用力對每一個節點做相關的設定
中心力 ⇒ d3.forceCenter
中心力作用於所有的節點而不是單獨的節點。它可以把所有節點的中心一致朝指定的位置平移,而且這種移動不會修改速度也不會影響節點間的相對位置。
forceCenter 旗下有一些API 可以進行相關設定: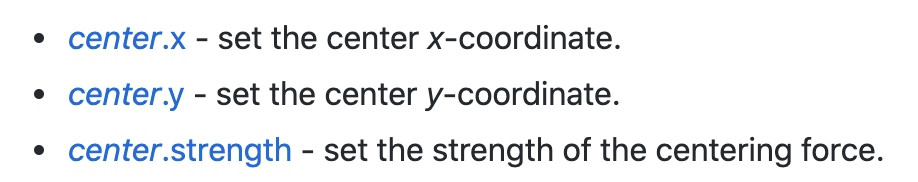
碰撞力 ⇒ d3.forceCollide
節點之間互相排斥的斥力(相互碰撞排斥),這個斥力會阻止節點相互重疊,可以使用 .strength( ) 這個API去設定斥力的強度
forceCollide 旗下有一些API 可以進行相關設定:
連結力 ⇒ d3.forceLink
使用 d3.forceLink( ) 這個 API 將兩個節點設定 link 連線到一起之後,就可以開始設定連結力了~這個力會根據兩個節點間的距離把兩個節點拉近或推遠,力的強度和兩者的距離成正比,就像彈簧一樣。
forceLink 旗下有一些 API 可以進行相關設定: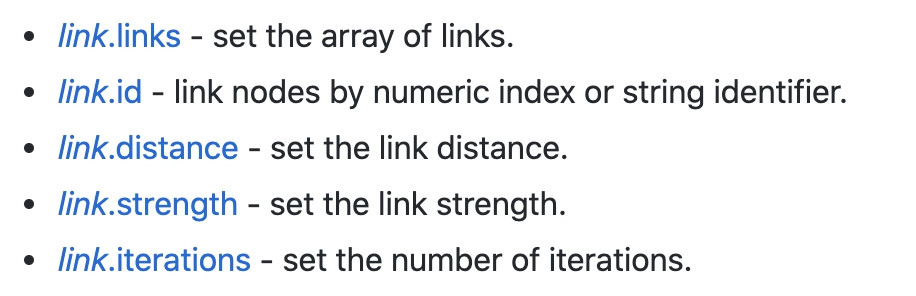
電荷力 ⇒ d3.forceManyBody
模擬所有節點間的相互作用力,如果設定是正值,節點間就會相互吸引;如果設定是負值,節點間就會相互排斥。這樣可以用來模擬電荷吸引力,而力的大小也和節點間的距離有關。
forceManyBody 旗下有一些API 可以進行相關設定:
定位力 ⇒ d3.forceX、d3.forceY、d3.forceRadial
定位力可以把節點沿著指定的維度推向一個指定位置,這些位置又可以透過三個不同的API去設定
d3.forceX:在 X軸方向推或者拉所有的節點
d3.forceY:在 Y軸 方向推或者拉所有的節點
d3.forceRadial:形成一個圓環,把所有的節點都往這個圓環上相應的位置推
這三個方法旗下也有一些 API 可以進行相關設定: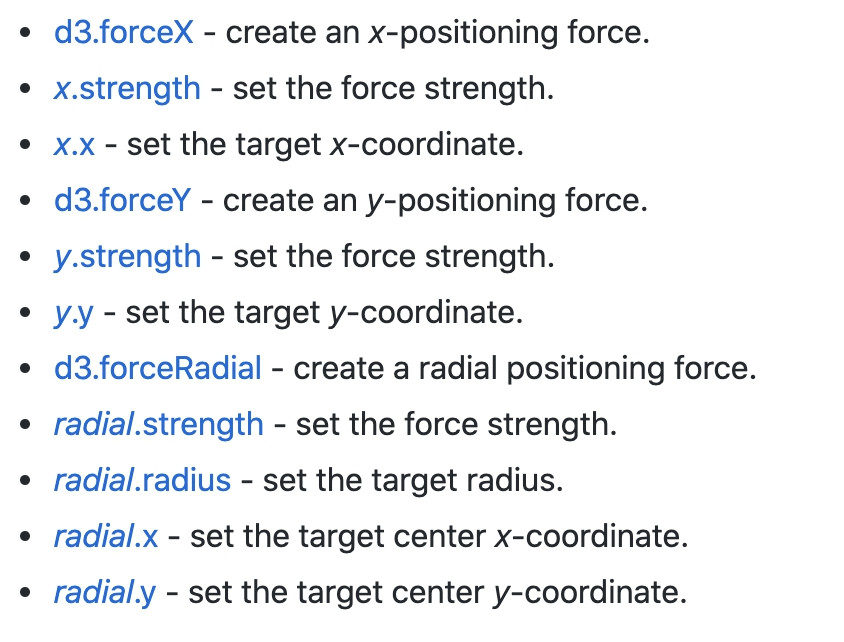
由於 force 的細節設定實在太多,這邊只能挑常用的幾個講,如果想實際操作看各種參數的設定,可以玩玩看這個範例。這個範例非常厲害,作者把各種參數都放在左方的選擇欄,我們可以藉由調整數值去看這些參數對力導向圖的作用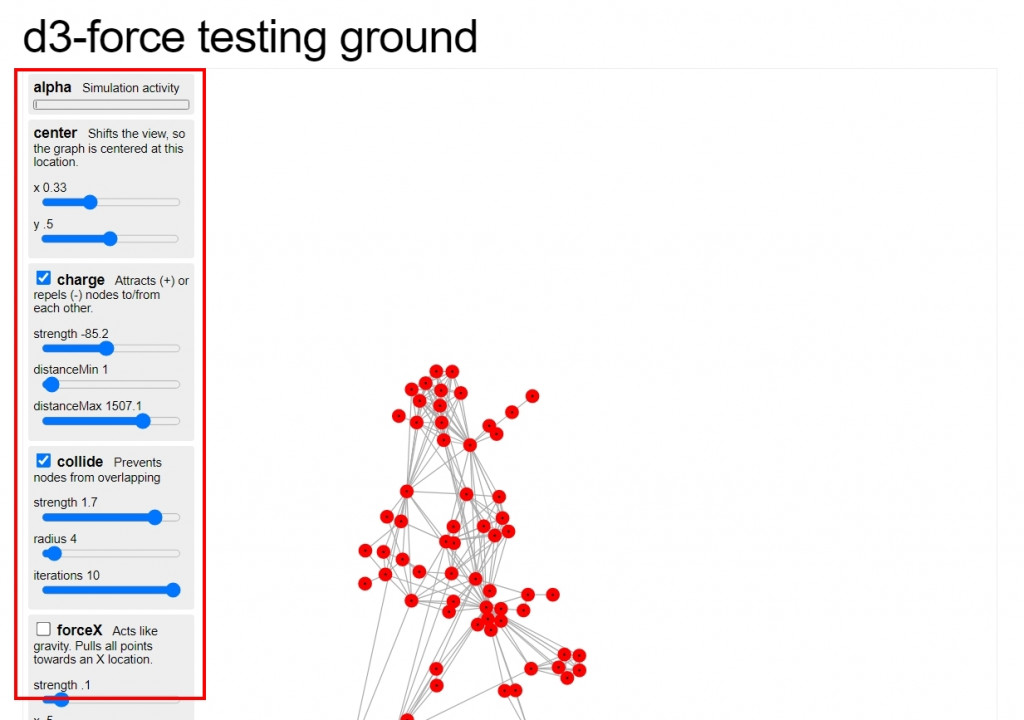
看完上面的解說後,我們趕快來實際看看要怎麼建立力學圖吧!
d3.forceSimulation( )使用 D3 來建立力學導向圖時,我們要先用 d3.forceSimulation 建立一個力模擬器並指定到 DOM 元素身上,這個模擬器就能用來監聽整體內部node變化,並開始執行、暫停或重新啟動引力模擬。如果没有指定 DOM 元素就會默認為空陣列,力模擬器會自動啟動。
一旦建立好力模擬器之後,它就會開始自動執行。接著會在每一個動畫影格進行一次模擬粒子運動的迭代,而整體的模擬預設是在300個迭代後結束。我們可以使用屬於力模擬器 simulation 旗下的 API 來設定這些力學的參數~一樣先看到官方文件提供哪些方法: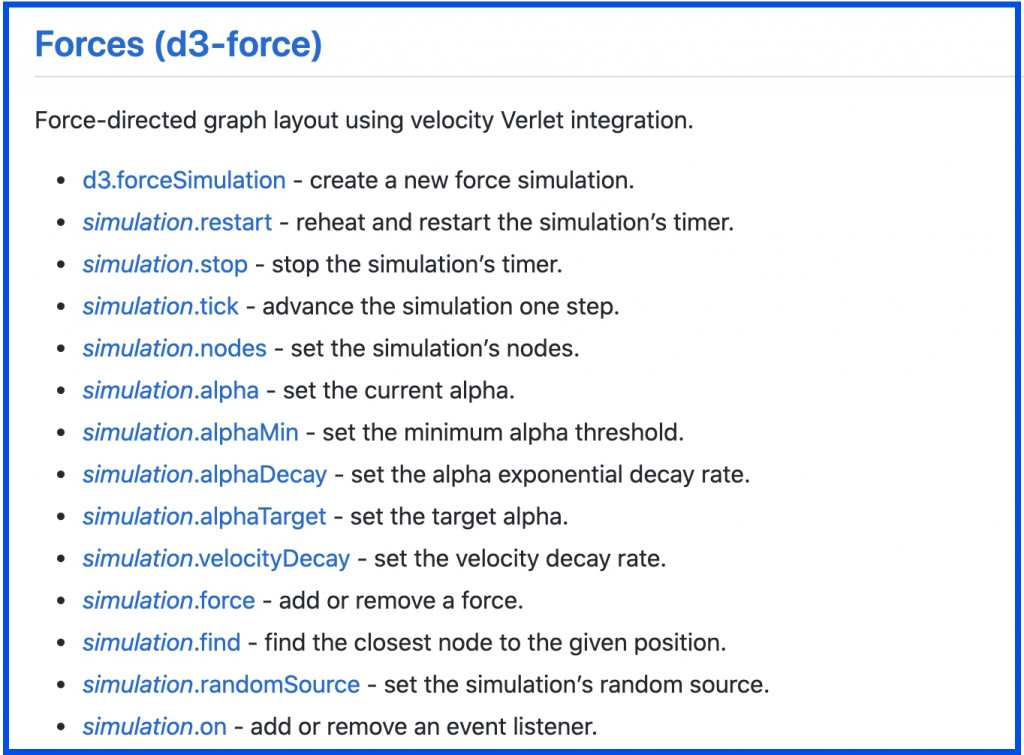
接著看到一些比較常用的:
simulation.restart、simulation.stop、simulation.tick
這幾個方法是來控制模擬器重新執行、停止、停止後手動前進
simulation.nodes
將力模擬圖建立的元素與資料綁定
simulation.alpha、simulation.alphaMin、simulation.alphaDecay
前面有提過,力模擬圖的節點們向中心聚攏的收斂方式是使用 alpha 的參數去控制,這幾個 API 就是用來控制 alpha 的值。在力模擬圖一建立並開始執行時,alpha 值設定為1,並在經過 300次迭代 (iterations) 之後衰減為0,這時候就會看到整個力模擬圖呈現靜止的狀態。如果希望力模擬圖永遠不靜止的話,可以把 alpha 的參數設定為0
— simulation.alphaMin:alpha 小於 alphaMin 設定的值時,力模擬器就會停止運作
— simulation.alphaDecay: 控制 alpha 減少的速度
simulation.velocityDecay
設定摩擦力的係數,數值1是無摩擦力的狀態(粒子運動很快),數值0則會讓所有粒子失去速度(凍結靜止),
simulation.force(name[,force])
建立好一個力模擬器後,我們可以使用 simulation.force() 把前面提到的五種不同作用力當成參數添加到力模擬器中。第一個參數name可以任意自訂想取的名稱,第二個參數則填入要使用的作用力。舉幾個常見的例子來說:
const simulation = d3.forceSimulation(nodes)
              // 設定節點連結的引力
              .force('link', d3.forceLink())
              // 在 y軸方向上施加一個力
              .force('y', d3.forceY().strength(0.025))
              // 節點間的電荷力
              .force('charge', d3.forceManyBody())
              // 節點間的斥力
              .force('collision', d3.forceCollide().radius(d => 4))
              //中心點的引力
              .force('center', d3.forceCenter(width / 2, height / 2))
simulation.on(事件, 方法)
啟動模擬器的事件監聽,並設定之後的callback function。力模擬器的事件監聽有兩種:
tick ⇒ 內部定時器每次運行 tick 之後
end ⇒ 當alpha < alphaMin,因此定時器停止之後
接著我們來看看範例吧!首先,先從最基本的力圖開始示範~以下是我們現在有的資料
// html
<svg class="forceElement" style="width:500; height:300"></svg>

// js
const data = [{name:'A'},{name:'B'},{name:'C'},{name:'D'},{name:'E'},{name:'F'},{name:'G'}]
我們先把資料都綁定到DOM上,並把這些資料都放在同樣的位置
const dots =  d3.select('.forceElement')
                    .append('g')
                    .selectAll('circle')
                    .data(data)
                    .enter()
                    .append('circle')
                    .attr('cx', 250)
                    .attr('cy', 150)
                    .attr('r', 15)
                    .style('fill', 'green')
                    .style('opacity', 0.4)
就會獲得一個全部點點都在中間的圖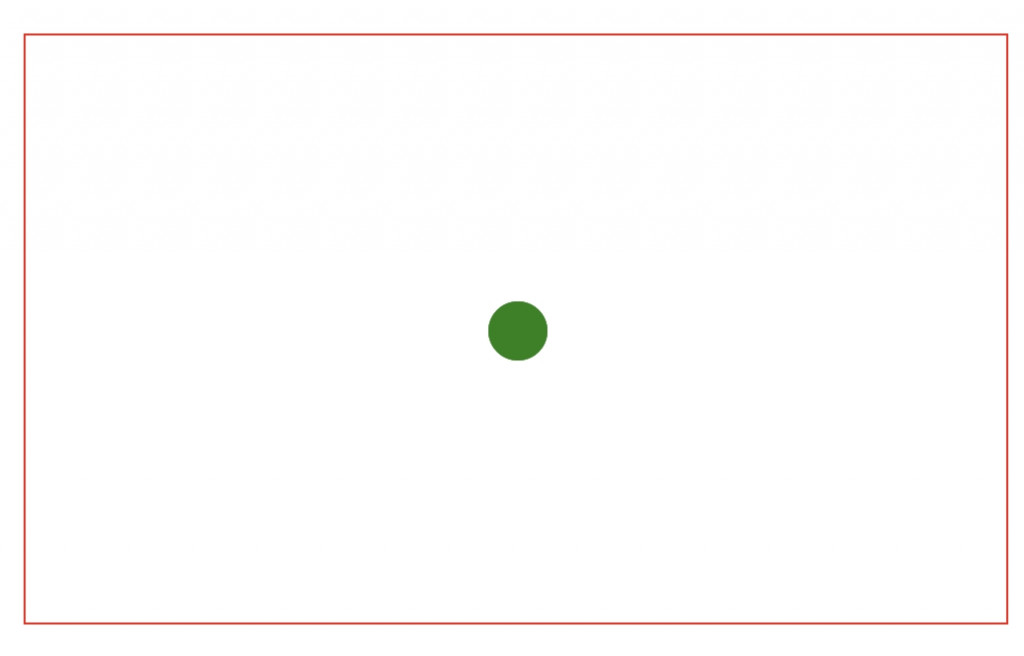
接著,開始建立力模擬器吧!
// 設定力模擬
const simulation = d3.forceSimulation()
 .alphaDecay(0) // 收斂永不停止
 .velocityDecay(0.2) // 設定摩擦係數
 .force("x", d3.forceX()) // 設定X軸平移位置
 .force("y", d3.forceY()) // 設定Y軸移動位置
 // 設定中心點位置
 .force("center", d3.forceCenter().x(250).y(150))
 // 設定節點間電荷力
 .force("charge", d3.forceManyBody().strength(1))
 // 設定節點間彼此的互斥力
 .force("collide", d3.forceCollide().strength(0.1).radius(40).iterations(0.2))
設定完力模擬器後,我們將模擬器綁定節點跟資料,並把每個DOM元素的位置設定為力模擬器返還的x, y 軸位置
// 將力模擬器的節點綁定資料,設定ticks開始時節點的動作
simulation.nodes(data)
          .on("tick", function(d){
             dots.attr("cx", d => d.x)
                 .attr("cy", d => d.y)
            });
完成!這樣我們就得到了一個最基礎的力導向圖了~
接著我們來做個進階一點的力導向圖~首先,一樣先把手上的資料綁定到DOM上。設定顏色的 scaleOrdinal 方法大家可以先看過就好,後續的scale( )章節會再來仔細講解
// html
<svg class="forceGroup" style="width:500; height:300"></svg>

//js
const data = [
        { "name": "A", "group": 150 },
        { "name": "B", "group": 150 },
        { "name": "C", "group": 150 },
        { "name": "D", "group": 150 },
        { "name": "E", "group": 150 },
        { "name": "F", "group": 150 },
        { "name": "G", "group": 250 },
        { "name": "H", "group": 250 },
        { "name": "I", "group": 250 },
        { "name": "J", "group": 250 },
        { "name": "K", "group": 250 },
        { "name": "L", "group": 350 },
        { "name": "M", "group": 350 },
        { "name": "N", "group": 350 },
        { "name": "O", "group": 350 }
    ]

    // 設定顏色
    const colorScale = d3.scaleOrdinal()
	                        .domain([150, 250, 350])
	                        .range(["red", "blue", "orange"])

    // 建立圓點,全都位於正中央
    const node = d3.select('.forceGroup')
               .append('g')
               .selectAll("circle")
               .data(data)
               .enter()
               .append('circle')
               .attr('r', 20)
               .attr('cx', 250)
               .attr('cy', 150)
               .style('fill', d=>colorScale(d.group))
               .style('opacity', '0.6')
接著一樣來設定力模擬器,但這次要在 d3.forceX( ) 這邊增加一個設定。使用 d3.forceX().strength(0.5).x(d => d.group) 來設定根據 group 這個key去將我們的資料分組,同一組的放在一起
// 設定力模擬器
const simulation = d3.forceSimulation()
    .force("x", d3.forceX().strength(0.5).x(d => d.group))
    .force("y", d3.forceY().strength(0.1).y( 150 ))
    .force("center", d3.forceCenter().x(250).y(150))
    .force("charge", d3.forceManyBody().strength(1))
    .force("collide", d3.forceCollide().strength(.1).radius(20).iterations(1))
最後,把這個力模擬器綁定資料
// 將力模擬器的節點綁定資料
simulation.nodes(data)
          .on("tick", function(d){
            node.attr("cx", d => d.x)
                .attr("cy", d => d.y)
            });
這樣一來,我們就能成功把資料分類並放在不同組啦!
再來,我們來寫寫看這種搭配連結的力導向圖吧!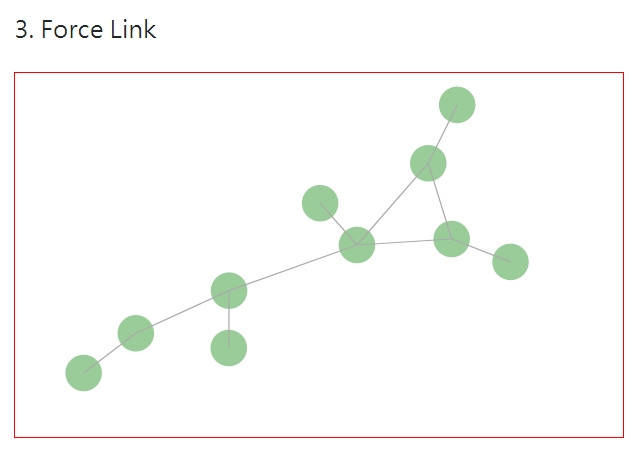
這邊要注意的是,我們的資料除了要有設定圓點的data之外,也要有設定link的data才能繪製出連結的線。link的資料包含兩種資訊:
它們用來設定哪些點要用link去串接在一起,所以我們的資料就會長這樣
// html
<svg class="forceLink" style="width:500; height:300"></svg>

// js
const data = {
    "nodes": [
        {"id": 1, "name": "A"},
        {"id": 2, "name": "B"},
        {"id": 3, "name": "C"},
        {"id": 4, "name": "D"},
        {"id": 5, "name": "E"},
        {"id": 6, "name": "F"},
        {"id": 7, "name": "G"},
        {"id": 8, "name": "H"},
        {"id": 9, "name": "I"},
        {"id": 10, "name": "J"}
			    ],
    "links": [
        {"source": 1, "target": 2},
        {"source": 1, "target": 3},
        {"source": 1, "target": 6},
        {"source": 2, "target": 3},
        {"source": 2,"target": 7},
        {"source": 3,"target": 4},
        {"source": 8,"target": 3},
        {"source": 4,"target": 5},
        {"source": 4,"target": 9},
        {"source": 5,"target": 10}
      ]
    }
要注意的是,大部分人一定不會拿到這麼漂亮的資料,一般公司的資料也不是長這樣 ( 哪來的source 跟 target )。所以當你拿到資料時,請先用前幾章提到的資料整理API們去把資料整理成自己想要的格式。
整理好資料後,我們把資料綁定到DOM上,來建立原點跟連結線段
const dots =  d3.select('.forceLink')
                    .append('g')
                    .selectAll('circle')
                    .data(data.nodes)
                    .enter()
                    .append('circle')
                    .attr('r', 15)
                    .style('fill', 'green')
                    .style('opacity', 0.4)

  const link = d3.select('.forceLink')
                  .selectAll("line")
                  .data(data.links)
                  .join("line")
                  .style("stroke", "#aaa")
接著建立力模擬器,並把力模擬器綁定原點跟線段,這樣就能得到有線段連結的力導向圖啦!
  // 設定力模擬器
  const simulation = d3.forceSimulation(data.nodes)
          .force("link",  d3.forceLink().id(d=> d.id).links(data.links))
          .force("charge", d3.forceManyBody().strength(-300))
          .force("center", d3.forceCenter(250, 150))
          .on('tick', ticked)


  // 設定 ticked 方法
  function ticked(d){
      link
      .attr("x1", function(d) { return d.source.x; })
      .attr("y1", function(d) { return d.source.y; })
      .attr("x2", function(d) { return d.target.x; })
      .attr("y2", function(d) { return d.target.y; });

      dots.attr("cx", d=> d.x)
          .attr("cy", d => d.y);
   }
這個範例我們來結合 d3 的hover事件跟 tooltips 玩玩看~我想要滑鼠滑過力圖時,會顯示當下圓點的半徑長度,實際操作如下圖
一樣先把資料綁定到DOM元素上,並且設定跟綁定力模擬器
// html
<div class="hoverWrap position-relative">
    <svg class="forceHover" style="width:500; height:300"></svg>
</div>

// js
const data = [{'r': 3}, {'r':34}, {'r': 23}, {'r': 33},
    {'r': 13},{'r': 22},{'r': 43},{'r': 17},{'r': 38}]

const dots = d3.select('.forceHover')
                .selectAll('circle')
                .data(data)
                .enter()
                .append('circle')
                .attr('r', d => d.r)
                .attr('fill', 'blue')
                .attr('opacity', 0.3)
// 設定力模擬器
const simulation = d3.forceSimulation()
        .force("center", d3.forceCenter().x(250).y(150))
        .force("charge", d3.forceManyBody().strength(.3))
                    .force("collide",d3.forceCollide().strength(.1).radius(30).iterations(1))
//綁定資料
simulation.nodes(data)
          .on('tick', function(d){
            dots.attr('cx', d=>d.x)
                .attr('cy', d=>d.y)
          })
接著我們建立tooltips,並啟動原點的 mouseover 跟 mouseleave事件
// 建立tooltips
const tooltips = d3.select(".hoverWrap")
                .append("div")
                .style("opacity", 0)
                .style('position', 'absolute')
                .attr("class", "tooltip")
                .style("background-color", "white")
                .style("border", "solid")
                .style("border-width", "2px")
                .style("border-radius", "5px")
                .style("padding", "5px")
// hover
dots.on('mouseover', mouseover)
    .on('mouseleave', mouseleave)
再來我們要設定mouseover 跟 mouseleave時要執行的方法,並且使用 d3.pointer 去指定tooltips的位置
function mouseover(event, d){
    console.log(d)
    d3.select(this)
      .attr('stroke', 'black')
      .attr('stroke-width', '3px')
      .attr('opacity', 0.7)
      .style('cursor', 'pointer')

    let pt = d3.pointer(event, this)
    tooltips.style('opacity', 1)
            .style('left', pt[0]+ 10 +'px')
            .style('top', pt[1]+'px')
            .html(`半徑:${d.r}`)
}

function mouseleave(event, d){
    d3.select(this)
      .attr('stroke', 'none')
      .attr('stroke-width', '0')
      .attr('opacity', 0.3)

    tooltips.style('opacity', 0)
}
這樣就完成啦~~
再來一個範例~~~這次我們要結合拖曳事件,但我們先來個基礎版,只要拖曳圓點就好
我們先把資料綁定到DOM元素上,並建立力模擬器
// 資料
const data = [{name:'A'},{name:'B'},{name:'C'},{name:'D'},{name:'E'},{name:'F'},{name:'G'}]

// 建立原點,目前全部都在同個位置
const dots = d3.select('.forceDrag')
        .append('g')
        .selectAll('circle')
        .data(data)
        .enter()
        .append('circle')
        .attr('r', 25)
        .attr('cx', 50)
        .attr('cy', 50)
        .style("fill", "#19d3a2")
        .style("fill-opacity", 0.3)
        .attr("stroke", "#b3a2c8")
        .style("stroke-width", 4)
        .style('cursor', 'pointer')

// 建立力模擬圖
const simulation = d3.forceSimulation()
    .force("center", d3.forceCenter().x(200).y(150))
    .force("charge", d3.forceManyBody().strength(1))
    .force("collide", d3.forceCollide().strength(.1).radius(30).iterations(1));

simulation.nodes(data)
          .on("tick", function(d){
               dots.attr("cx", d => d.x)
                   .attr("cy", d => d.y)
            });
再來要把拖曳事件綁定到DOM元素上,並且設定拖曳的方法
// 拖曳開始
function dragstarted(event, d) {
    // console.log(d)
    d3.select(this)
      .style('fill-opacity', 0.6)
    d.fx = d.x;
    d.fy = d.y;
    simulation.alphaTarget(.03).restart();
}
// 拖曳期間
function dragged(event, d) {
    d.fx = event.x;
    d.fy = event.y;
}
// 拖曳結束
function dragended(event, d) {
    simulation.alphaTarget(.03);
    d3.select(this)
      .style('fill-opacity', 0.3)
    d.fx = null;
    d.fy = null;
}

// 綁定拖曳事件
dots.call(d3.drag()
            .on("start", dragstarted)
            .on("drag", dragged)
            .on("end", dragended));
最後一個範例,我們來看看把有連結的力圖加上拖曳效果該怎麼做吧~其實這個也很簡單,就是結合範例三跟範例五而已。
首先,我們先建立好帶有連結線條的力圖
// html
<svg class="forceDragLink" style="width:500; height:300"></svg>

// js
const data = {
    "nodes": [
        {"id": 1, "name": "A"},
        {"id": 2, "name": "B"},
        {"id": 3, "name": "C"},
        {"id": 4, "name": "D"},
        {"id": 5, "name": "E"},
        {"id": 6, "name": "F"},
        {"id": 7, "name": "G"},
        {"id": 8, "name": "H"},
        {"id": 9, "name": "I"},
        {"id": 10, "name": "J"}
			    ],
    "links": [
        {"source": 1, "target": 2},
        {"source": 1, "target": 3},
        {"source": 1, "target": 6},
        {"source": 2, "target": 3},
        {"source": 2,"target": 7},
        {"source": 3,"target": 4},
        {"source": 8,"target": 3},
        {"source": 4,"target": 5},
        {"source": 4,"target": 9},
        {"source": 5,"target": 10}
      ]
    }

const dots =  d3.select('.forceDragLink')
                    .append('g')
                    .selectAll('circle')
                    .data(data.nodes)
                    .enter()
                    .append('circle')
                    .attr('r', 15)
                    .style('fill', 'green')
                    .style('opacity', 0.6)
                    .style('cursor', 'pointer')

  const link = d3.select('.forceDragLink')
                  .selectAll("line")
                  .data(data.links)
                  .join("line")
                  .style("stroke", "#aaa")

  // 設定力模擬器
  const simulation = d3.forceSimulation(data.nodes)
      .force("link",  d3.forceLink().id(d=> d.id).links(data.links))
      .force("charge", d3.forceManyBody().strength(-300))
      .force("center", d3.forceCenter(250, 150))
      .on('tick', ticked)


  // 綁定節點
  function ticked(d){
      link
      .attr("x1", function(d) { return d.source.x; })
      .attr("y1", function(d) { return d.source.y; })
      .attr("x2", function(d) { return d.target.x; })
      .attr("y2", function(d) { return d.target.y; });

      dots.attr("cx", d=> d.x)
          .attr("cy", d => d.y);
   }
接著再綁定拖曳事件
// 綁定拖曳事件
dots.call(d3.drag()
            .on("start", dragstarted)
            .on("drag", dragged)
            .on("end", dragended));

function dragstarted(event, d){
    d3.select(this)
      .style('fill', 'pink')
    d.fx = d.x;
    d.fy = d.y;
    simulation.alphaTarget(.03).restart(); // 停止後需要重新開始
}

function dragged(event, d){
    d.fx = event.x;
    d.fy = event.y;
}

function dragended(event, d){
    d3.select(this)
      .style('fill', 'green')
      .style('opacity', 0.6)
    d.fx = null
    d.fy = null
}
這樣就完成啦~
以上就是D3 Force 的詳細解說~終於講完了(撒花)!下篇就是比較簡單的縮放效果~
這邊附上本章的程式碼與圖表 Github 、 Github Page,需要的人請自行取用~