上篇回顧
分布式可觀測性 Logging 淺談
分布式可觀測性 Structured Log
繼續淺談Observability的另1個基石
在單體式架構上,主要的監控對象是OS與機器這物理節點, 所以經常直接使用OS自帶的工具.
以Linux來說top來看每個Process的CPU使用率、記憶體用量, mpstat, vmstat, iostat等等的.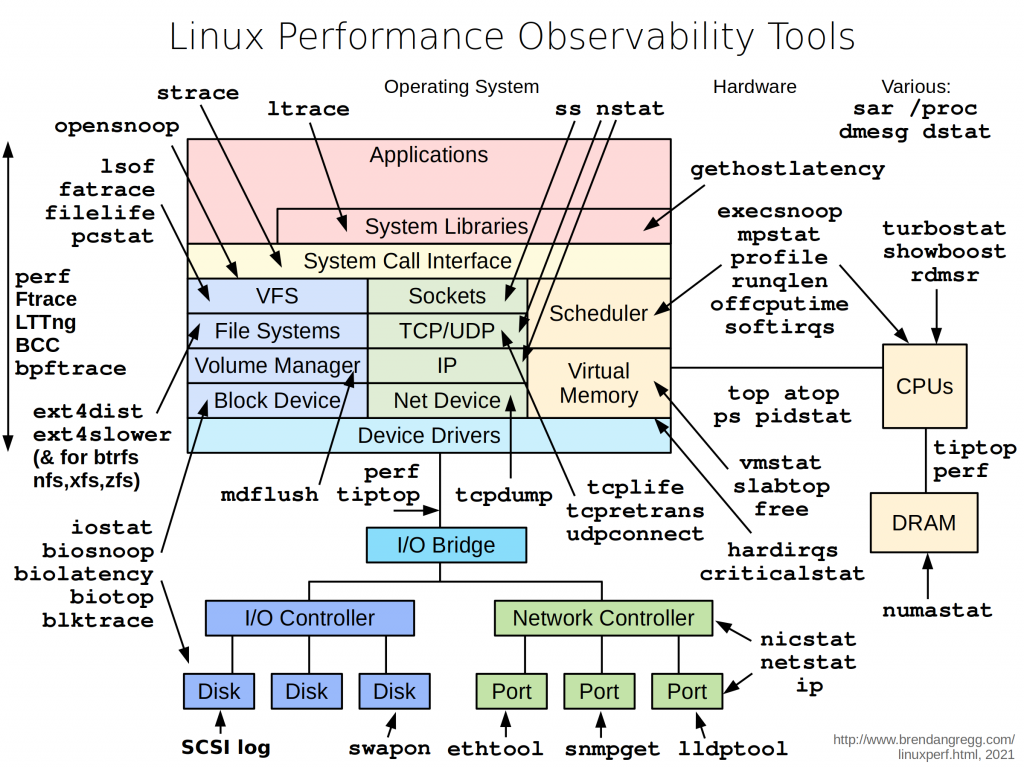
Windows則是Task manager.
透過這些OS提供的命令與工具來監控.
但在現在分布式架構下, 數十數百台機器或是在VM上的OS, 監控的可觀測性成了挑戰.
於是陸續誕生了Cacti、Zabbix、Prometheus等很多監控系統,
它們的特色是metrics數據的收集、數據的存放、數據的查詢展示都分離開來. 彼此透過網路協議與介面來傳遞資料.
現在常見的架構有兩種,
一種是數據的收集以Library形式, 與業務系統整合在程式專案中,
在程式碼埋點的方式, 以Client調用的角度, 把調用資源或服務的耗時、請求量、慢查詢量,
甚至能收集GC的資訊等等的送給另一個獨立出來的數據處理服務去做處理與分析.
以Go來說, Prometheus就有提供這樣的Library
Go自帶的pprof其實也是一種
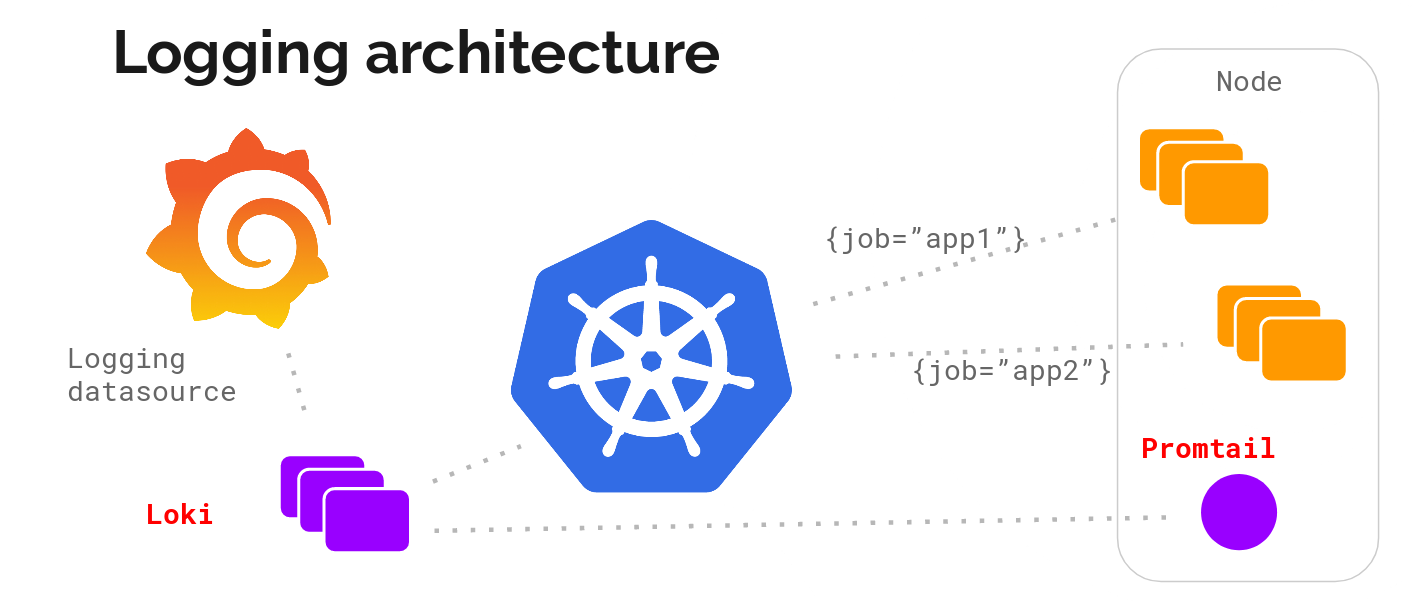
另一種則是以Agent(Sidecar)或Exporter形式, 由它來負責數據收集與數據做處理 .
通常它會負責採集特定指標資訊例如, 主機資訊, 或是各Process的CPU用量, 記憶體用量.
Prometheus提供非常多exporter來採集特定指標
之後要介紹的Fluent-bit或Promtail則是以Agent形式
5種常見的Metrics類型
這裡主要依據Prometheus提供的Metric Types
type Gauge interface {
	Metric
	Collector

	// Set sets the Gauge to an arbitrary value.
	Set(float64)
	// Inc increments the Gauge by 1. Use Add to increment it by arbitrary
	// values.
	Inc()
	// Dec decrements the Gauge by 1. Use Sub to decrement it by arbitrary
	// values.
	Dec()
	// Add adds the given value to the Gauge. (The value can be negative,
	// resulting in a decrease of the Gauge.)
	Add(float64)
	// Sub subtracts the given value from the Gauge. (The value can be
	// negative, resulting in an increase of the Gauge.)
	Sub(float64)

	// SetToCurrentTime sets the Gauge to the current Unix time in seconds.
	SetToCurrentTime()
}
type Counter interface {
	Metric
	Collector

	// Inc increments the counter by 1. Use Add to increment it by arbitrary
	// non-negative values.
	Inc()
	// Add adds the given value to the counter. It panics if the value is <
	// 0.
	Add(float64)
}
type Histogram interface {
	Metric
	Collector

	// Observe adds a single observation to the histogram. Observations are
	// usually positive or zero. Negative observations are accepted but
	// prevent current versions of Prometheus from properly detecting
	// counter resets in the sum of observations. See
	// https://prometheus.io/docs/practices/histograms/#count-and-sum-of-observations
	// for details.
	Observe(float64)
}
type Summary interface {
	Metric
	Collector

	// Observe adds a single observation to the summary. Observations are
	// usually positive or zero. Negative observations are accepted but
	// prevent current versions of Prometheus from properly detecting
	// counter resets in the sum of observations. See
	// https://prometheus.io/docs/practices/histograms/#count-and-sum-of-observations
	// for details.
	Observe(float64)
}
Metrics的強大在於幾乎可以針對任意指標進行數值計算後, 決定展示或是通知報警.
至於到底要對什麼指標做監控. 這才是重要的思考點
也許有人想到Response time做監控, 只要系統回應時間逐漸變慢, 就報警通知
也許是針對錯誤日誌發生的速率, 做計算後超過一個閥值做通知
也許是資源超過一個閥值, 做通知
Mettrics的設計也不是一蹴而就的, 要慢慢根據具體的需求變化反覆跌帶來更新設計.