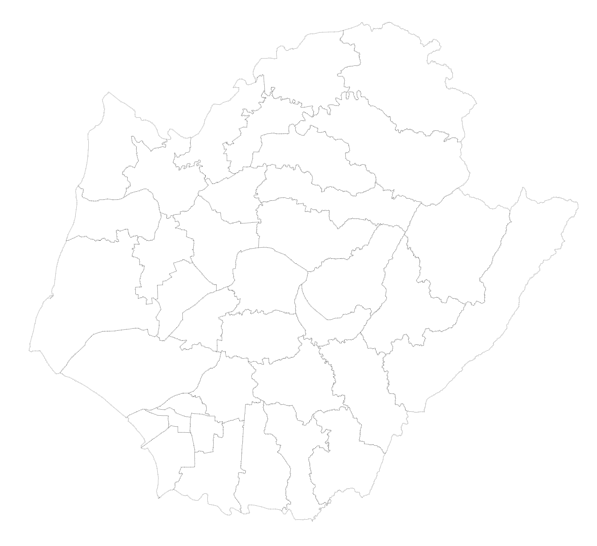
昨天的步驟已經將資料整理得差不多了,接下來要進行畫圖與先前的步驟一樣使用<path>和已經篩選過的資料tainanGeojson來繪製地圖。
程式碼如下
  g.selectAll("path")
    .data(tainanGeojson)
    .join("path")
    .style('fill',"white")
    .style("stroke", "black")
    .style("stroke-width",".25")
    .style("stroke-opacity",".5")
    .attr("d", path)
這個時候你應該可以看到畫出了台南市的地圖如下
接來我們要進行上色,因此在上色之前我們必須找到一個數字映射到顏色的函式用來轉換不同顏色所表示的數字大小,因此這裡一樣使用d3.scaleSequential來做轉換,先前說明過這個轉換函式給定domain([數字,數字])會轉換0~1的數字範圍,由於我們要繪製的是土地房屋每平方公尺平均價格的分層設色圖,所以我們就以最大值和最小值當domain值
程式碼如下
let maxNum = d3.max(tainanGeojson,(d)=>(d.properties.HOUSEPRICE));
let minNum = d3.min(tainanGeojson,(d)=>(d.properties.HOUSEPRICE));
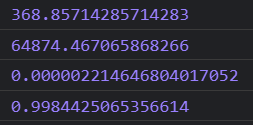
console.log(minNum);
console.log(maxNum);
console.log(d3.scaleSequential().domain([minNum, maxNum])(369));
console.log(d3.scaleSequential().domain([minNum, maxNum])(64774));
可以使用console.log來觀看轉換過程有沒有問題
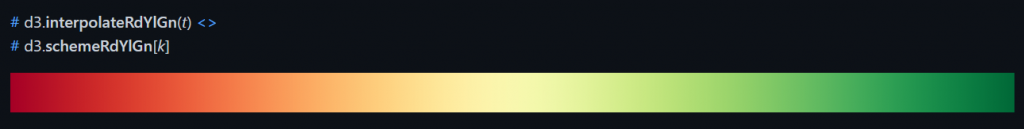
因此接下來我們選出一個顏色範圍放入scaleSequential()
如上圖官方scaleSequential說明中,除了上次提到可以在scaleSequential()放入自行轉換函數以外,API另個說明也可以帶入d3-scale-chromaticAPI裡面的Diverging中的顏色
這裡我們取interpolateRdYlGn這個插值器
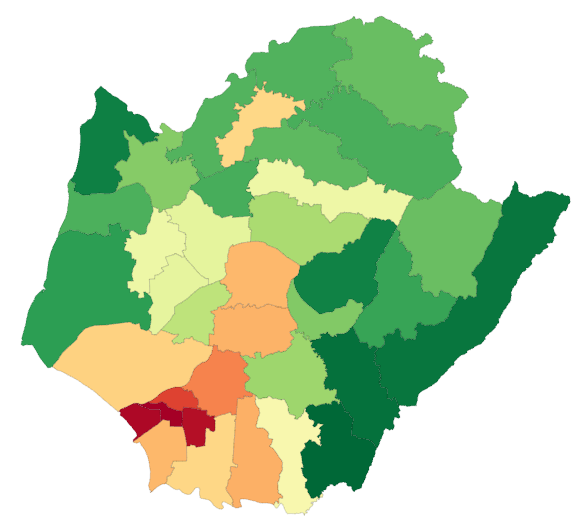
因此使用fill填色的時候加入轉換函數來將價格高低轉換成顏色
另外值得一提的是宣告轉換函數的時候,這邊希望是房價土地平均價數字高的呈現紅色、數字低的呈現綠色,因此顏色轉換函數的domain()使用maxNum做為下限,minNum做為上限
程式碼如下
let maxNum = d3.max(tainanGeojson,(d)=>(d.properties.HOUSEPRICE));
let minNum = d3.min(tainanGeojson,(d)=>(d.properties.HOUSEPRICE));
let redGreen = d3.scaleSequential(d3.interpolateRdYlGn).domain([maxNum, minNum]);
g.selectAll("path")
.data(tainanGeojson)
.join("path")
.style('fill',"white")
.style("stroke", "black")
.style("stroke-width",".25")
.style("stroke-opacity",".5")
.attr("d", path)
.style("fill",d=>(redGreen(d.properties.HOUSEPRICE)))
最後應該會呈現如下圖
接下來我們希望添加一些互動來呈現地圖內的詳細資料,構想是使用tooltip來呈現內容,因此可以在滑鼠移到該區域的時候插入一個tooltip,其中tooltip內容的資料是來自於滑鼠移到該區域的資料,具體程式碼如下
g.selectAll("path")
//與先前程式碼雷同故省略
//與先前程式碼雷同故省略
//與先前程式碼雷同故省略
.style("fill",d=>(redGreen(d.properties.HOUSEPRICE)))
.on("mouseenter",function(e){
    let getTheDtName = d3.select(this).data()[0].properties.TOWNNAME;
    let getTheDtPrice = parseInt(d3.select(this).data()[0].properties.HOUSEPRICE);
    svg.append("g")
        .attr("id","tooltip")
        .html(`
<rect rx="4" x="${e.x}" y="${e.y}" width="100" height="75" style="fill:darkblue;"></rect>
<text font-weight="bold" style="fill:white;">
    <tspan x="${e.x+20}" y="${e.y+35}">${getTheDtName}</tspan>
    <tspan x="${e.x+20}" y="${e.y+55}">${getTheDtPrice}元</tspan>
    <tspan x="${e.x+45}" y="${e.y+70}" style="font-size:10px;">Avg:NT$/m²</tspan>
</text>
            `)
})
我們宣告getTheDtName 來取得當滑鼠滑入該區域的時候所擁有的資料內容,由於先前已經綁定資料到元素上面,因此可以使用d3.select(this).data()來獲取當前的被滑鼠滑入到的資料內容,其中要取得行政區域的名字則用物件取值的方式依序帶入
getTheDtPrice宣告的變數與getTheDtName的方式大同小異,只不過我希望將顯示整數就好,因此使用parseInt()來將小數點轉換成整數。
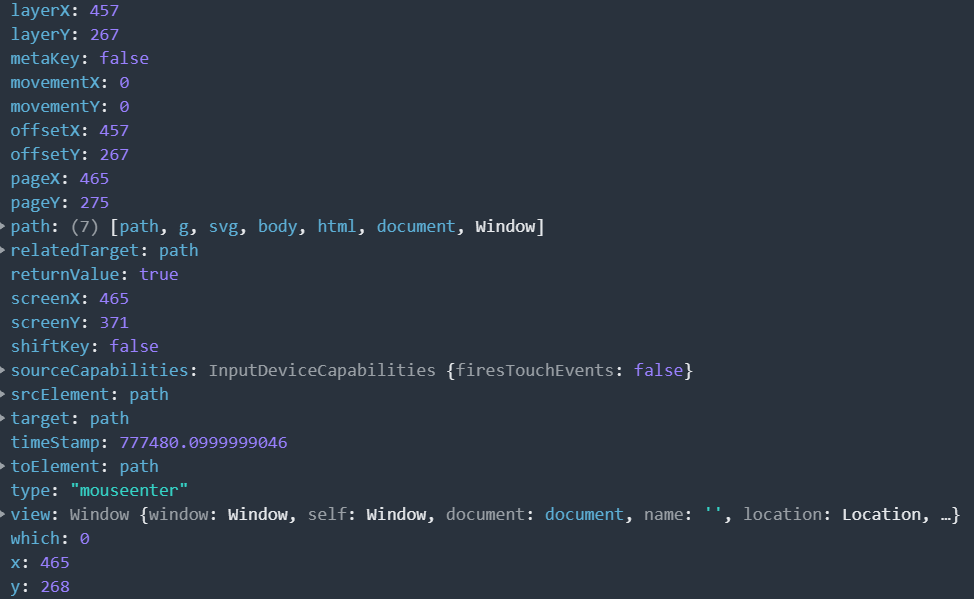
.html()的函式裡面使用樣板字面值的方式顯示,其中的e代表的是當滑鼠觸發mouseenter的事件,我們可以嘗試著console.log(e)來看看呈現什麼東西
為了能夠在svg裡面換行,這邊顯示文字的方式使用<text>和<tspan>排列並對每一行文字的x和y位置調整,使用<rect>作為邊框設計,這邊設定一個id為tooltip以便滑鼠移出該區域的時候可以容易移除整個tooltip,到目前為止的顯示畫面如果你嘗試著將滑鼠移入一些區域的時候應該會呈現如下圖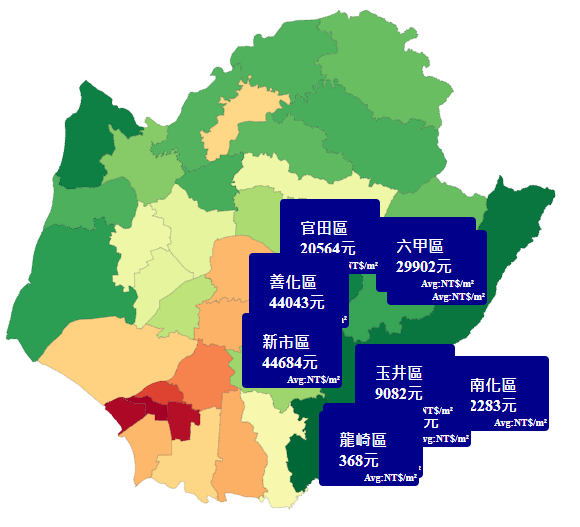
接下來我們就加入滑鼠移出事件,由於先前已經有先設置id了,因此移除的時候會相對簡單。
.on("mouseleave",function(e){
    svg.select("#tooltip").remove();
})
目前有一個小問題當產生出tooltip的時候滑鼠移到tooltip上面會再次重新觸發mouseenter事件和mouseleave事件的狀況,明明顯示在同一個區域tooltip卻一直顯示→消失→顯失→消失如下圖
因此我們可以在css的地方加入pointer-events如下,將其設成none的話就不會成為滑鼠游標的目標,換句話說有點像是滑鼠事件看不到tooltip
svg #tooltip{
    pointer-events: none;
  }
我們可以在畫面載入的時候依照房價由低到高填入到行政區域顏色,因此構想是先進行資料排序,然後接在transition()的時候,使用delay(),每次延遲的時間取決於資料的索引值來填充色彩。這邊使用d3.sort來排列房價的低到高,函式裡面指定要依照哪項資料排列,具體作法如下
const tainanGeojsonSort = d3.sort(tainanGeojson,d=>(d.properties.HOUSEPRICE));
g.selectAll("path")
.data(tainanGeojsonSort)
//中間省略
//中間省略
//中間省略
.on("mouseleave",function(e){
    svg.select("#tooltip").remove();
})
.transition().delay((d,i)=>(i*100))
.style("fill",d=>(redGreen(d.properties.HOUSEPRICE)))
這邊設置100毫秒,另外提醒一下記得加入fill填色的話要把寫在transition()之前的
fill給刪除,動畫才能正確執行。
完整程式碼如下
let width = 1200;
let height = 675;
const projection = d3.geoMercator()
                    .center([120.24,23.18 ])
                    .scale(50000);
const svg = d3.select("body")
            .append("svg")
            .attr("width", width)
            .attr("height", height);
const path = d3.geoPath()
                .projection(projection);
const g = svg.append("g");
d3.json("taiwanDistrict.json")
    .then(function(topology) {
    const geojson =  topojson
                .feature(topology, topology.objects.TOWN_MOI_1100415)
                .features;
    const tainanGeojson = [];
    geojson.forEach(function(el) {
        if(el.properties.COUNTYNAME=="臺南市"){
            tainanGeojson.push(el);
        }
    })
    d3.csv("taiwan109s4.csv")
    .then(function(csvData){
        console.log(csvData);
        const districtMap = d3.group(csvData, d => d["鄉鎮市區"]);
        console.log(districtMap);
        tainanGeojson.forEach(function(el){
            for (let [key, value] of districtMap) {
                if(key===el.properties.TOWNNAME){
                    el.properties.HOUSEPRICE= d3.mean(value, d=>d["單價元平方公尺"]);
                }
            }
        });
        const tainanGeojsonSort = d3.sort(tainanGeojson,d=>(d.properties.HOUSEPRICE));
        console.log(tainanGeojsonSort);
        let maxNum = d3.max(tainanGeojson,(d)=>(d.properties.HOUSEPRICE));
        let minNum = d3.min(tainanGeojson,(d)=>(d.properties.HOUSEPRICE));
        const redGreen = d3.scaleSequential(d3.interpolateRdYlGn).domain([maxNum, minNum]);

        g.selectAll("path")
        .data(tainanGeojsonSort)
        .join("path")
        .style('fill',"white")
        .style("stroke", "black")
        .style("stroke-width",".25")
        .style("stroke-opacity",".5")
        .attr("d", path)
        .on("mouseenter",function(e){
            let getTheDtName = d3.select(this).data()[0].properties.TOWNNAME;
            let getTheDtPrice = parseInt(d3.select(this).data()[0].properties.HOUSEPRICE);
            svg.append("g")
            .style("border",function(d){console.log(e)})
            .attr("id","tooltip").html(`
            <rect rx="4" x="${e.x}" y="${e.y}" width="100" height="75" style="fill:darkblue;"></rect>
                <text font-weight="bold" style="fill:white;">
                    <tspan x="${e.x+20}" y="${e.y+35}">${getTheDtName}</tspan>
                    <tspan x="${e.x+20}" y="${e.y+55}">${getTheDtPrice}元</tspan>
                    <tspan x="${e.x+45}" y="${e.y+70}" style="font-size:10px;">Avg:NT$/m²</tspan>
                </text>
            `)
        })
        .on("mouseleave",function(e){
            svg.select("#tooltip").remove();
        })
        .transition().delay((d,i)=>(i*100))
        .style("fill",d=>(redGreen(d.properties.HOUSEPRICE)))
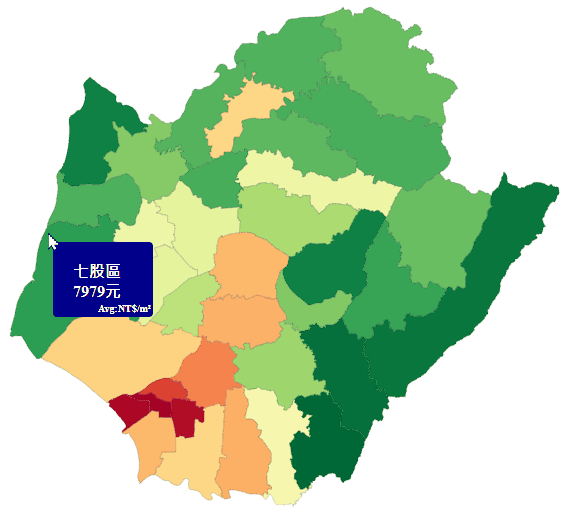
實際效果如下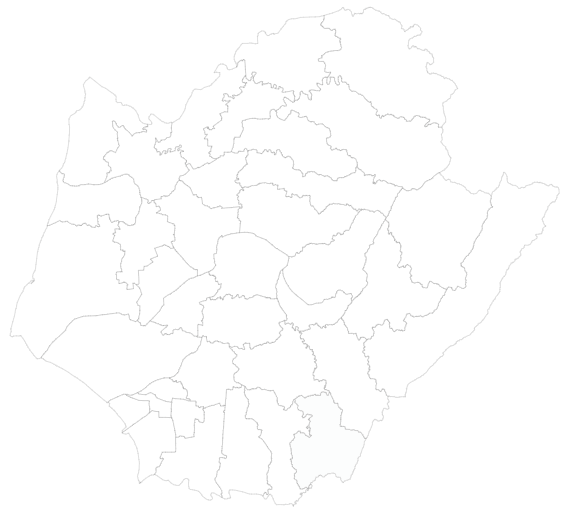
GithubPage如下

 iThome鐵人賽