今天進入到重頭戲了,
昨天介紹完我們使用的工具我們今天就要使用它,
(1)html部分
這個部分主要是接收java傳來的資料,
然後用const text = $("#tick_data").val();
const myArr = JSON.parse(text);
去將json string轉化為json array,
然後將值帶入data: myArr.myArrayList
<html xmlns:th="http://www.thymeleaf.org">
<head>
	<script type="text/javascript" th:src="@{/js/jquery-3.3.1.min.js}" ></script>
	<script src="https://cdn.highcharts.com.cn/highcharts/highcharts.js"></script>
    <script src="https://cdn.highcharts.com.cn/highcharts/modules/exporting.js"></script>
    <script src="https://cdn.highcharts.com.cn/highcharts/modules/series-label.js"></script>
    <script src="https://cdn.highcharts.com.cn/highcharts/modules/oldie.js"></script>
    <script src="https://code.highcharts.com.cn/highcharts-plugins/highcharts-zh_CN.js"></script>

</head>
<body>

<input type="hidden" id="tick_data" th:value="${tick_data}"/>

<div id="container" style="max-width:1200px;height:600px"></div>
<script type="text/javascript">
const text = $("#tick_data").val();
const myArr = JSON.parse(text);

var chart = Highcharts.chart('container', {
		title: {
				text: '2021-09-28緯穎6669趨勢圖'
		},
		yAxis: {
				title: {
						text: '價格'
				}
		},
		xAxis: {
			labels: {
			enabled: false
			}
		},
		legend: {
				layout: 'vertical',
				align: 'right',
				verticalAlign: 'middle'
		},
		plotOptions: {
				series: {
						label: {
								connectorAllowed: false
						},
						pointStart: 2021
				}
		},
		series: [{
				name: 'ticks',
				data: myArr.myArrayList
		}],
		responsive: {
				rules: [{
						condition: {
								maxWidth: 500
						},
						chartOptions: {
								legend: {
										layout: 'horizontal',
										align: 'center',
										verticalAlign: 'bottom'
								}
						}
				}]
		}
});
</script>
</body>
</html>
(2)java controller的部分(前幾章有)
String tickdate = pRequest.getParameter("tickdate") == null ? "" : pRequest.getParameter("tickdate");

		String tick_data = shioajiService.test(tickdate);
		JSONArray jsonArray = new JSONArray(tick_data);
		Gson gson  = new Gson();

		model.addAttribute("tick_data", gson.toJson(jsonArray));
		return "show";
(3)python api的部分(前幾章有)
@app.route('/testdata', methods=['GET'])
def test_tick():
    api = sj.Shioaji(simulation=True)

    api.login(
        person_id="PAPIUSER01",
        passwd="2222",
        contracts_cb=lambda security_type: print(f"{repr(security_type)} fetch done.")
    )

    date_temp = request.args.get('tickdate')
    print("date_temp: "+date_temp)
    tick = api.ticks(
    contract=api.Contracts.Stocks["6669"],
    date=date_temp
    )
    print("tick: "+json5.dumps(tick['close']))
    return json5.dumps(tick['close'])
(4)執行結果如圖: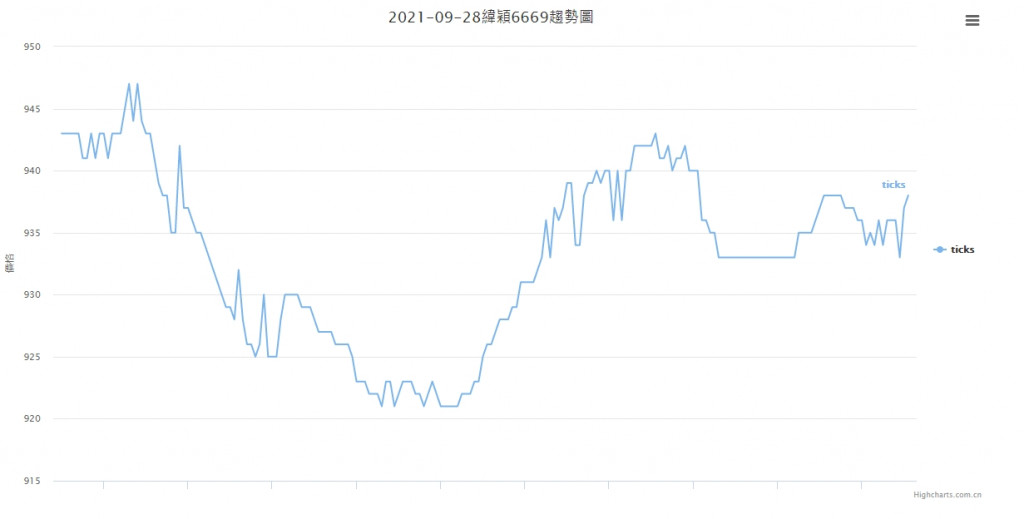
其實還有很多細節沒修,像python api的部分,
要看什麼股票也是可以用url傳參數控制、
標題也是可以自動帶入不用寫死,
只是先做的範例之後還可以用得更完善,
也恭喜大家看到這裡至少已經將第一個API成功視覺化了~


 iThome鐵人賽