統整一下到底要如何Gradient Descent去計算Logistic Regression:
首先我們有輸入值x1,x2,y,用輸入值帶入active function可以得到y-hat: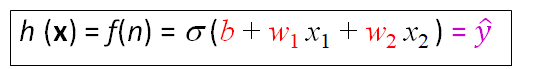
還有error function的參數w1,w2,b,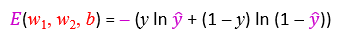
然後就可以用梯度下降去獲得Net input了(也就是上一篇的那個偏微分) eta表示learning rate (校正幅度)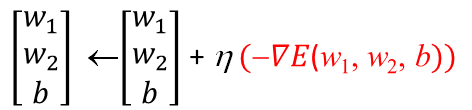
如何找到梯度下降的偏微分曲線>>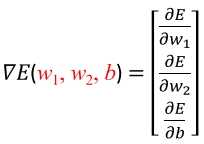
首先找到E,也就是error function: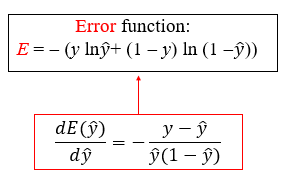
有了E,接下來找y-hat: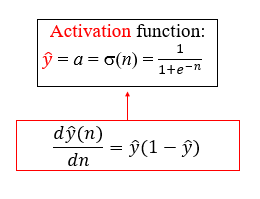
最後就可以得到: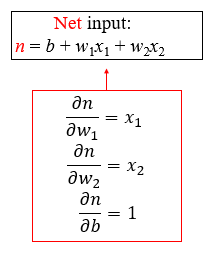
接下來就會發現他們的相互關係然後用y跟y-hat去替換: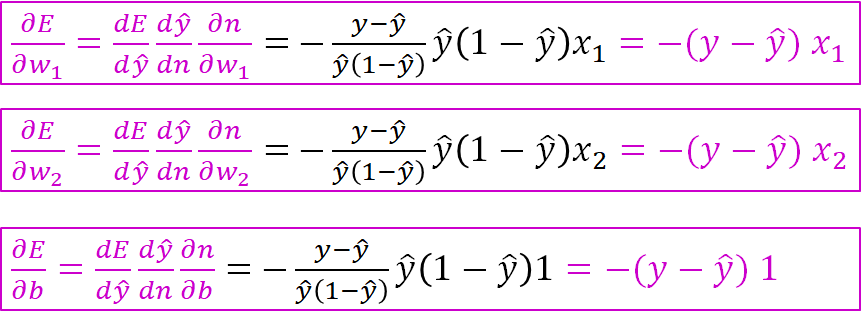
也就是說梯度下降的偏微分曲線長這樣: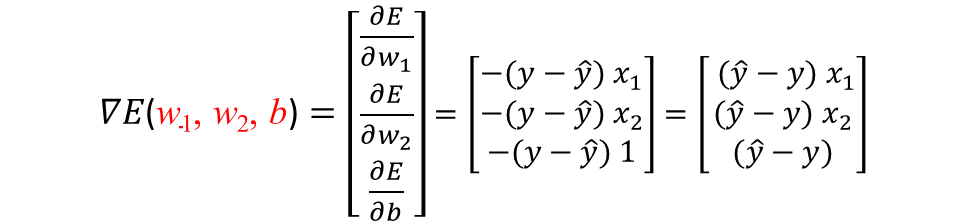
數學式表示: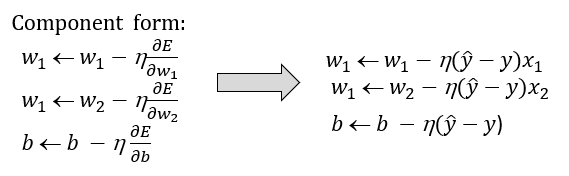
向量式表示: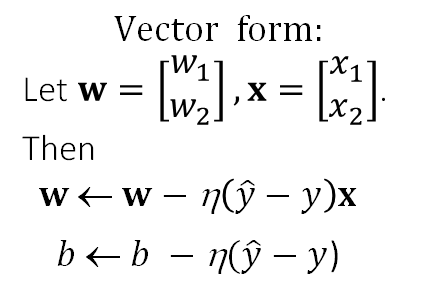
這就是如何用Gradient Descent去計算Logistic Regression了。
 minimindy
