我們這回要利用先前建立的主要功能函式以及下載下來的股票資料做預測了。首先由於我們展示的方式為利用python的plotly套件做圖,因此必須先下載安裝plotly,執行以下程式碼即可進行安裝。
! pip install plotly
安裝完過後我們還要下載中文的字體,這樣結果圖表內的中文才能夠正常顯示,執行以下程式碼即可下載安裝。
!wget -O TaipeiSansTCBeta-Regular.ttf https://drive.google.com/uc?id=1eGAsTN1HBpJAkeVM57_C7ccp7hbgSz3_&export=download

from matplotlib.font_manager import fontManager
fontManager.addfont('TaipeiSansTCBeta-Regular.ttf')
下載完成過後,先設定好圖表的顯示模式,分別設定中文字體、顯示模式以及警告。
# set graph's font
matplotlib.rc('font', family='Taipei Sans TC Beta')
# display negative normally
plt.rcParams["axes.unicode_minus"] = False

# cancel displaying pandas information reset alarm
pd.options.mode.chained_assignment = None
接著將股票資料的csv檔匯入並轉換成python的dataframe格式,分為訓練資料以及標籤。
# load csv file
filename = "stock2021.csv"
df = pd.read_csv(filename, encoding = "big5")
ddtrain = df[["收盤價", "最高價", "最低價"]]
ddprice = df[["收盤價"]]
接著利用上回建立好的第一個函式,將資料與標籤區分為訓練集資料、訓練集標籤、測試集資料、測試集標籤。
# preprocess data before training
scaler = MinMaxScaler()
scalert = MinMaxScaler()
train_x, train_y, test_x, test_y = load_data(ddtrain, ddprice, sequence_length = 10, split = 0.8)
接下來就是建立模型與訓練模型了,這裡同樣利用上回所建立好的兩個函式,將模型建立完成並取得測試集的預測結果。
# create model and training
model = build_model()
predict_y = train_model(train_x, train_y, test_x)
predict_y = scalert.inverse_transform([[i] for i in predict_y])
test_y = scalert.inverse_transform(test_y)
下一步將plotly的資料給設定好並輸出。
# preprocess plotly's information
dd2 = pd.DataFrame({"predict": list(predict_y), "label": list(test_y)})
dd2["predict"] = np.array(dd2["predict"]).astype("float64")
dd2["label"] = np.array(dd2["label"]).astype("float64")
# display the result with plotly
data = [
Scatter(y = dd2["predict"], name = "預測", line = dict(color = "blue", dash = "dot")),
Scatter(y = dd2["label"], name = "收盤價", line = dict(color = "red"))
]
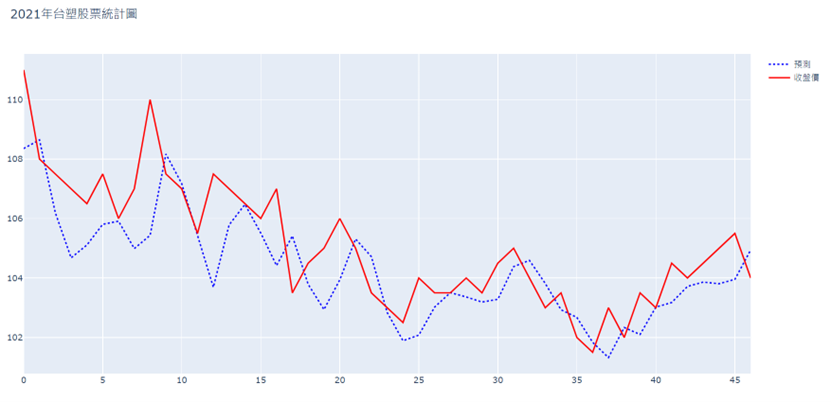
plot({"data": data, "layout": Layout(title = "2021年台塑股票統計圖")}, auto_open = True)
最後你會得到一個html,結果類似如下。這樣就完成了RNN訓練股票預測的模型啦!讀者也可以嘗試看看以不同股票或是以基金利用RNN模型進行預測喔!