今天來說一下觀測資料,其實觀測資料可以分成很多,譬如氣象站儀器量測到的大氣狀態(溫度、風速等),或者氣象雷達量測到的回波。但有的時候,更細的分,又有所謂的遙測、掩星等。在此就不多做說明。
介紹氣象局可以下載歷史觀測的網站,請點這。
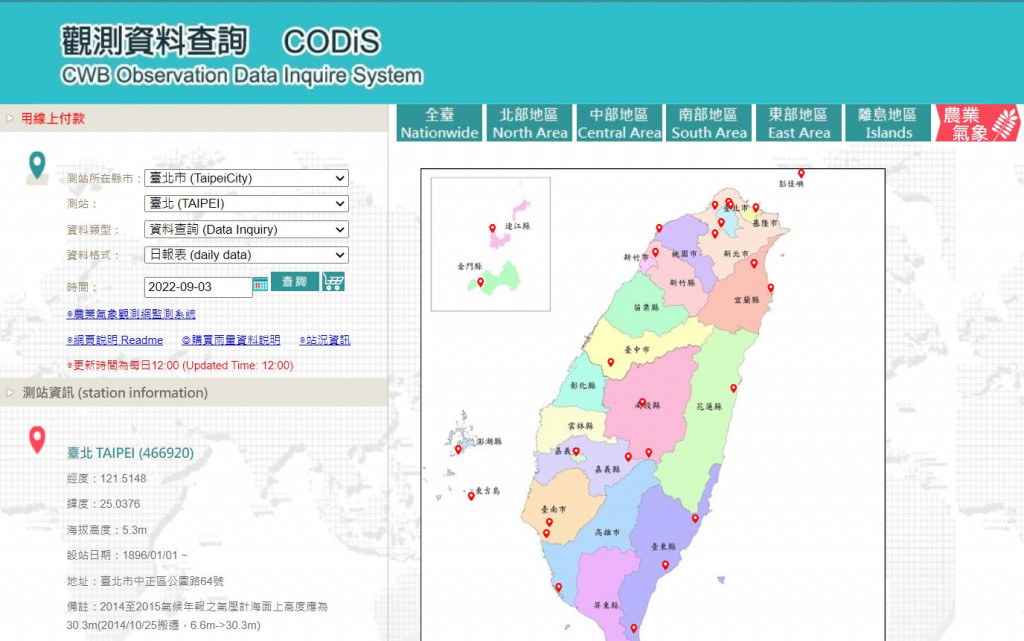
裡面可以選擇測站、日期、月、日、小時的資料。
下圖為選擇台北測站、9月3日日報表的設定
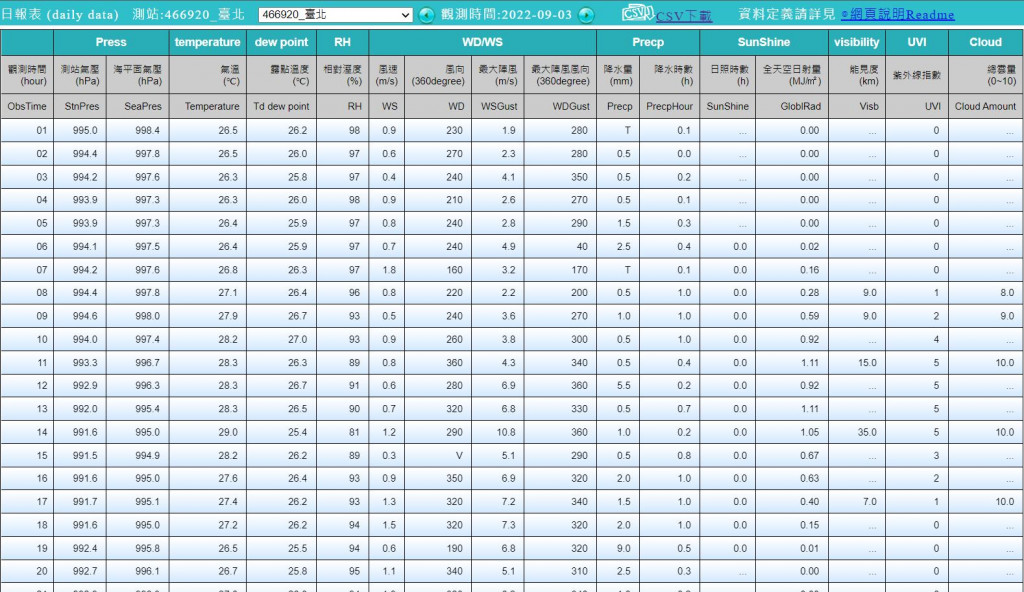
點選查詢之後,會跳轉頁面如下,右上角會有一個CSV下載選項,點選之後即可下載此頁面的資料。
那當然,這一份csv是可以直接使用excel讀取的,好像沒有必要特別說明,我就先跳過這一部分。
那今天如果我想用python讀取的話,要怎麼做呢?
這邊用一個很白癡的方式,就是將csv當成記事本文件讀,不用任何pandas、xarray等套件處理。
處理的程式如下
with open("466920-2022-09-03.csv","r",encoding='utf8') as fn:
    for line in fn:
        content.append(line)
fn.close()

newct = []
for ct in content:
    temp = ct.split("\n")[0].split(",")
    newct.append([x[1:-1] for x in temp])

#WS and temprature index position
idxws = newct[1].index("WS")
idxtmp = newct[1].index("Temperature")
ws, tmp = [], []

for hrs in range(24):
    ws.append(float(newct[2+hrs][idxws]))
    tmp.append(float(newct[2+hrs][idxtmp]))
print(ws,tmp)
依照上面的程式碼,就可以得到一天當中每一個小時的風速及溫度數值。
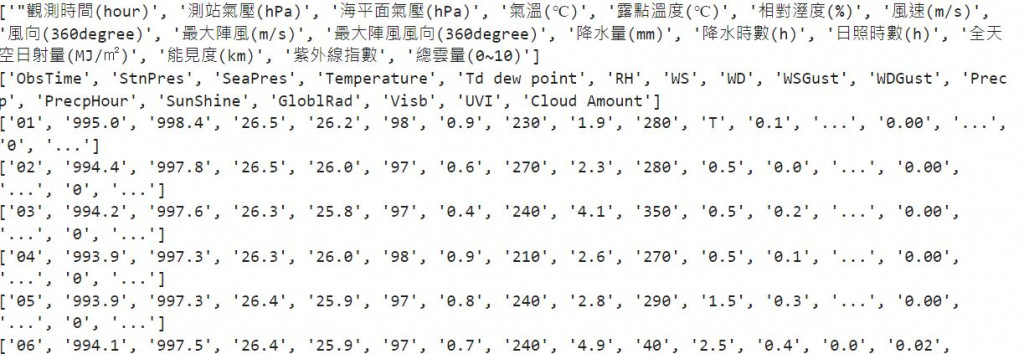
上述的程式碼,newct會是一個很多個list組成的list,每個list如下圖所示

所以每個list都是每一列的資料。
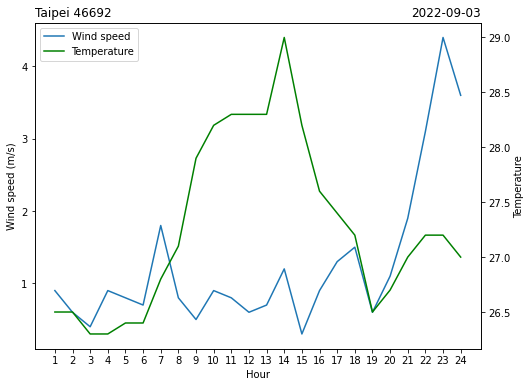
可以將上述的資料視覺化
import matplotlib.pyplot as plt
fig, ax = plt.subplots(figsize=(8,6))
p1 = ax.plot(range(1,25),ws,label="Wind speed")
ax.set_xticks(range(1,25))
ax.set_xlabel("Hour")
ax.set_ylabel("Wind speed (m/s)")
ax.set_title("Taipei 46692", loc="left")
ax.set_title("2022-09-03", loc="right")
#ax.legend()
ax2 = ax.twinx()
p2 = ax2.plot(range(1,25),tmp,"g-",label="Temperature")
ax2.set_ylabel("Temperature")
#plt.egend([ax.patch,ax2.patch],loc="upper left")
p = p1 +p2
labs = [l.get_label() for l in p]
ax.legend(p, labs, loc='upper left')
就可以有下圖囉
會不會覺得這樣處理資料會發瘋呢?
明天介紹用pandas或xarray,就會覺得輕鬆多了
