昨天使用很基本的方式讀取csv檔,當然一定還有更方便的方法。
如果是用python的話,讀取csv最流行的套件應該是pandas啦,所以就是示範使用pandas讀取相同檔案囉。
如果沒有pandas 的話,記得先裝。
conda install -c conda-forge pandas
pip3 install pandas
讀取csv的話,就用read_csv方法。
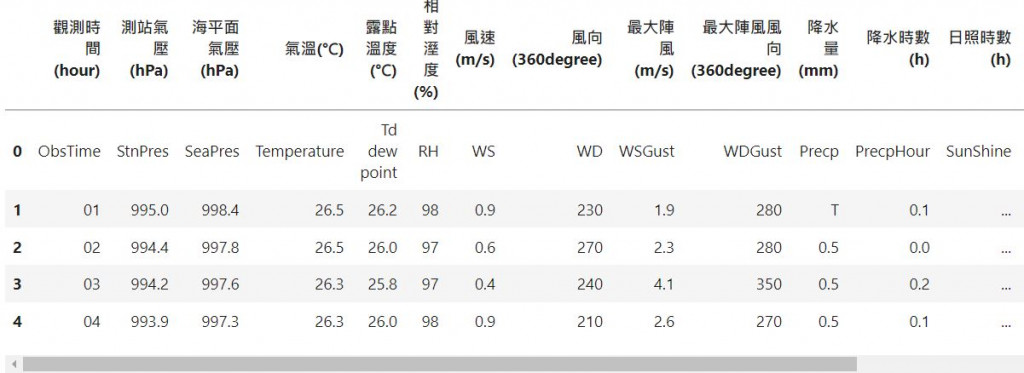
順便看一下前五列的資訊,直接變成很完整的資料表,不像昨天還要一直整理。
import pandas as pd
newct = pd.read_csv("466920-2022-09-03.csv",encoding='utf8')
newct.head()
list檔頭
head = list(newct)
print(head)
檔頭資訊如圖所示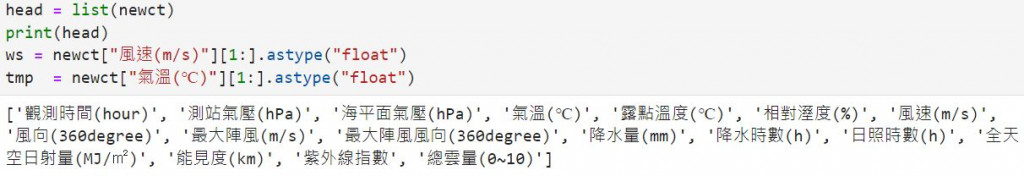
選取風速跟氣溫的檔頭
ws = newct["風速(m/s)"][1:].astype("float")
tmp  = newct["氣溫(℃)"][1:].astype("float")
就可以達到昨天一樣的效果囉
import matplotlib.pyplot as plt
fig, ax = plt.subplots(figsize=(8,6))
p1 = ax.plot(range(1,25),ws,label="Wind speed")
ax.set_xticks(range(1,25))
ax.set_xlabel("Hour")
ax.set_ylabel("Wind speed (m/s)")
ax.set_title("Taipei 46692", loc="left")
ax.set_title("2022-09-03", loc="right")
#ax.legend()
ax2 = ax.twinx()
p2 = ax2.plot(range(1,25),tmp,"g-",label="Temperature")
ax2.set_ylabel("Temperature")
#plt.egend([ax.patch,ax2.patch],loc="upper left")
p = p1 +p2
labs = [l.get_label() for l in p]
ax.legend(p, labs, loc='upper left')