在昨日「上」篇的內容,我們示範如何使用排程任務在指定時間從交易所或相關網站取得大盤籌碼以及指數、個股行情資訊,並將這些資料存至 MongoDB 資料庫。在今日「中」篇的部分,我們會將收集的資料以自動化的方式產出報表,包含大盤籌碼資訊、產業資金流向、個股漲跌幅排行、成交量值排行以及外資投信買賣超排行等資訊,並且以 Excel 檔案的形式輸出,製作屬於自己的市場觀察報告。
exceljs 套件是一個工作表管理器,用於讀寫、操作 xlsx 與 csv 檔案。為了操作 Excel 檔案,我們先安裝 exceljs 套件:
$ npm install --save exceljs
本文內容主要聚焦在如何產生報表,關於
exceljs的詳細使用方式,請參考官方 Repo 說明。
套件安裝完成後,我們建立 ReportModule 用來產生市場觀察報告。打開終端機,使用 Nest CLI 建立 ReportModule:
$ nest g module report
執行後,Nest CLI 會在專案下建立 src/report 目錄,在該目錄下新增 report.module.ts 檔案,並且將 ReportModule 加入至 AppModule 的 imports 設定。
在 ReportModule,我們會利用前一天實作的 MarketStatsModule 的 MarketStatsRepository 與 TickerModule 的 TickerRepository 向 MongoDB 資料庫存取資料。為了依賴注入使用 MarketStatsRepository 與 TickerRepository,開啟 src/report/report.module.ts 檔案,在 ReportModule 的設定中匯入 MarketStatsModule 與 TickerModule:
import { Module } from '@nestjs/common';
import { MarketStatsModule } from '../market-stats/market-stats.module';
import { TickerModule } from '../ticker/ticker.module';

@Module({
  imports: [MarketStatsModule, TickerModule],
})
export class ReportModule {}
為了實作報表輸出的各項方法,我們使用 Nest CLI 建立 ReportService:
$ nest g service report --no-spec
執行命令後,Nest CLI 會在 src/report 目錄下建立 report.service.ts 檔案,並且將 ReportService 加入至 ReportModule 的 providers 設定。
開啟 src/report/report.service.ts 檔案,實作 createWorkbook() 方法,透過 exceljs 建立一個 Excel 活頁簿:
import * as ExcelJS from 'exceljs';
import { Injectable } from '@nestjs/common';

@Injectable()
export class ReportService {

  async createWorkbook() {
    const workbook = new ExcelJS.Workbook();
    return workbook;
  }
}
建立 Excel 活頁簿(workbook)後,在這個活頁簿中,我們將新增以下 工作表(worksheet)內容:
在 ReportService 中,我們將會實作產生這些工作表的各項方法。
在建立大盤籌碼工作表之前,我們需要先實作存取大盤籌碼數據的方法。
開啟 src/market-stats/market-stats.repository.ts 檔案,在 MarketStatsRepository 實作 getMarketStats() 方法,取得大盤籌碼數據:
import { DateTime } from 'luxon';
import { Injectable } from '@nestjs/common';
import { InjectModel } from '@nestjs/mongoose';
import { Model } from 'mongoose';
import { MarketStats, MarketStatsDocument } from './market-stats.schema';

@Injectable()
export class MarketStatsRepository {
  constructor(
    @InjectModel(MarketStats.name) private readonly model: Model<MarketStatsDocument>,
  ) {}

  ...

  async getMarketStats(options?: { days?: number, date?: string }) {
    const date = options?.date || DateTime.local().toISODate();
    const days = options?.days || 30;

    const results = await this.model.aggregate([
      { $match: { date: { $lte: date } } },
      { $project: { _id: 0, __v: 0, createdAt: 0 , updatedAt: 0 } },
      { $sort: { date: -1 } },
      { $limit: days + 1 },
    ]);

    const data = results.map((doc, i) => (i < results.length - 1 ? {
      ...doc,
      taiexChangePercent: doc.taiexPrice && Math.round((doc.taiexChange / (doc.taiexPrice - doc.taiexChange)) * 10000) / 100,
      usdtwdChange: doc.usdtwd && parseFloat((doc.usdtwd - results[i + 1].usdtwd).toPrecision(12)),
      finiTxfNetOiChange: doc.finiTxfNetOi && (doc.finiTxfNetOi - results[i + 1].finiTxfNetOi),
      finiTxoCallsNetOiValueChange: doc.finiTxoCallsNetOiValue && (doc.finiTxoCallsNetOiValue - results[i + 1].finiTxoCallsNetOiValue),
      finiTxoPutsNetOiValueChange: doc.finiTxoPutsNetOiValue && (doc.finiTxoPutsNetOiValue - results[i + 1].finiTxoPutsNetOiValue),
      top10SpecificTxfFrontMonthNetOiChange: doc.top10SpecificTxfFrontMonthNetOi && (doc.top10SpecificTxfFrontMonthNetOi - results[i + 1].top10SpecificTxfFrontMonthNetOi),
      top10SpecificTxfBackMonthsNetOiChange: doc.top10SpecificTxfBackMonthsNetOi && (doc.top10SpecificTxfBackMonthsNetOi - results[i + 1].top10SpecificTxfBackMonthsNetOi),
      retailMxfNetOiChange: doc.retailMxfNetOi && (doc.retailMxfNetOi - results[i + 1].retailMxfNetOi),
    } : doc)).slice(0, -1);

    return data;
  }
}
在 getMarketStats() 方法可指定 date 與 days 選項參數,可以根據日期取得過去天數的大盤籌碼數據。
完成後,開啟 src/report/report.service.ts 檔案,在 ReportService 實作 addMarketStatsSheet() 方法,產生 大盤籌碼工作表:
import * as ExcelJS from 'exceljs';
import * as numeral from 'numeral';
import { Injectable } from '@nestjs/common';
import { MarketStatsRepository } from '../market-stats/market-stats.repository';

@Injectable()
export class ReportService {
  constructor(
    private readonly marketStatsRepository: MarketStatsRepository,
  ) {}

  ...

  async addMarketStatsSheet(workbook: ExcelJS.Workbook, options: { date: string }) {
    const worksheet = workbook.addWorksheet();

    // 設定工作表欄位格式
    worksheet.columns = [
      { header: '日期', key: 'date', width: 10, style: { alignment: { vertical: 'middle', horizontal: 'center' } } },
      { header: '加權指數', key: 'taiexPrice', width: 15, style: { alignment: { vertical: 'middle', horizontal: 'center' }, fill: { type: 'pattern', pattern: 'solid', fgColor:{ argb: 'ffcdd2' } } } },
      { header: '漲跌', key: 'taiexChange', width: 12.5, style: { alignment: { vertical: 'middle', horizontal: 'center' }, fill: { type: 'pattern', pattern: 'solid', fgColor:{ argb: 'ffcdd2' } } } },
      { header: '漲跌幅', key: 'taiexChangePercent', width: 12.5, style: { alignment: { vertical: 'middle', horizontal: 'center' }, fill: { type: 'pattern', pattern: 'solid', fgColor:{ argb: 'ffcdd2' } } } },
      { header: '成交量(億)', key: 'taiexTradeValue', width: 15, style: { alignment: { vertical: 'middle', horizontal: 'center' }, fill: { type: 'pattern', pattern: 'solid', fgColor:{ argb: 'ffcdd2' } } } },
      { header: '外資\r\n買賣超(億)', key: 'finiNetBuySell', width: 15, style: { alignment: { vertical: 'middle', horizontal: 'center' }, fill: { type: 'pattern', pattern: 'solid', fgColor:{ argb: 'fff9c4' } } } },
      { header: '投信\r\n買賣超(億)', key: 'sitcNetBuySell', width: 15, style: { alignment: { vertical: 'middle', horizontal: 'center' }, fill: { type: 'pattern', pattern: 'solid', fgColor:{ argb: 'fff9c4' } } } },
      { header: '自營商\r\n買賣超(億)', key: 'dealersNetBuySell', width: 15, style: { alignment: { vertical: 'middle', horizontal: 'center' }, fill: { type: 'pattern', pattern: 'solid', fgColor:{ argb: 'fff9c4' } } } },
      { header: '融資\r\n餘額(億)', key: 'marginBalance', width: 15, style: { alignment: { vertical: 'middle', horizontal: 'center' }, fill: { type: 'pattern', pattern: 'solid', fgColor:{ argb: 'c8e6c9' } } } },
      { header: '融資\r\n餘額增減(億)', key: 'marginBalanceChange', width: 15, style: { alignment: { vertical: 'middle', horizontal: 'center' }, fill: { type: 'pattern', pattern: 'solid', fgColor:{ argb: 'c8e6c9' } } } },
      { header: '融券\r\n餘額(張)', key: 'shortBalance', width: 15, style: { alignment: { vertical: 'middle', horizontal: 'center' }, fill: { type: 'pattern', pattern: 'solid', fgColor:{ argb: 'c8e6c9' } } } },
      { header: '融券\r\n餘額增減(張)', key: 'shortBalanceChange', width: 15, style: { alignment: { vertical: 'middle', horizontal: 'center' }, fill: { type: 'pattern', pattern: 'solid', fgColor:{ argb: 'c8e6c9' } } } },
      { header: '外資台指期\r\nOI淨口數', key: 'finiTxfNetOi', width: 17.5, style: { alignment: { vertical: 'middle', horizontal: 'center' }, fill: { type: 'pattern', pattern: 'solid', fgColor:{ argb: 'bbdefb' } } } },
      { header: '外資台指期\r\nOI淨口數增減', key: 'finiTxfNetOiChange', width: 17.5, style: { alignment: { vertical: 'middle', horizontal: 'center' }, fill: { type: 'pattern', pattern: 'solid', fgColor:{ argb: 'bbdefb' } } } },
      { header: '外資台指買權\r\nOI淨金額(億)', key: 'finiTxoCallsNetOiValue', width: 17.5, style: { alignment: { vertical: 'middle', horizontal: 'center' }, fill: { type: 'pattern', pattern: 'solid', fgColor:{ argb: 'b3e5fc' } } } },
      { header: '外資台指買權\r\nOI淨金額增減(億)', key: 'finiTxoCallsNetOiValueChange', width: 17.5, style: { alignment: { vertical: 'middle', horizontal: 'center' }, fill: { type: 'pattern', pattern: 'solid', fgColor:{ argb: 'b3e5fc' } } } },
      { header: '外資台指賣權\r\nOI淨金額(億)', key: 'finiTxoPutsNetOiValue', width: 17.5, style: { alignment: { vertical: 'middle', horizontal: 'center' }, fill: { type: 'pattern', pattern: 'solid', fgColor:{ argb: 'b3e5fc' } } } },
      { header: '外資台指賣權\r\nOI淨金額增減(億)', key: 'finiTxoPutsNetOiValueChange', width: 17.5, style: { alignment: { vertical: 'middle', horizontal: 'center' }, fill: { type: 'pattern', pattern: 'solid', fgColor:{ argb: 'b3e5fc' } } } },
      { header: '十大特法台指\r\n近月OI淨口數', key: 'top10SpecificTxfFrontMonthNetOi', width: 20, style: { alignment: { vertical: 'middle', horizontal: 'center' }, fill: { type: 'pattern', pattern: 'solid', fgColor:{ argb: 'b2ebf2' } } } },
      { header: '十大特法台指\r\n近月OI淨口數增減', key: 'top10SpecificTxfFrontMonthNetOiChange', width: 20, style: { alignment: { vertical: 'middle', horizontal: 'center' }, fill: { type: 'pattern', pattern: 'solid', fgColor:{ argb: 'b2ebf2' } } } },
      { header: '十大特法台指\r\n遠月OI淨口數', key: 'top10SpecificTxfBackMonthsNetOi', width: 20, style: { alignment: { vertical: 'middle', horizontal: 'center' }, fill: { type: 'pattern', pattern: 'solid', fgColor:{ argb: 'b2ebf2' } } } },
      { header: '十大特法台指\r\n遠月OI淨口數增減', key: 'top10SpecificTxfBackMonthsNetOiChange', width: 20, style: { alignment: { vertical: 'middle', horizontal: 'center' }, fill: { type: 'pattern', pattern: 'solid', fgColor:{ argb: 'b2ebf2' } } } },
      { header: '散戶小台\r\nOI淨口數', key: 'retailMxfNetOi', width: 15, style: { alignment: { vertical: 'middle', horizontal: 'center' }, fill: { type: 'pattern', pattern: 'solid', fgColor:{ argb: 'b2dfdb' } } } },
      { header: '散戶小台\r\nOI淨口數增減', key: 'retailMxfNetOiChange', width: 15, style: { alignment: { vertical: 'middle', horizontal: 'center' }, fill: { type: 'pattern', pattern: 'solid', fgColor:{ argb: 'b2dfdb' } } } },
      { header: '散戶多空比', key: 'retailMtxLongShortRatio', width: 15, style: { alignment: { vertical: 'middle', horizontal: 'center' }, fill: { type: 'pattern', pattern: 'solid', fgColor:{ argb: 'b2dfdb' } } } },
      { header: '台指選擇權\r\nPut/Call Ratio', key: 'txoPutCallRatio', width: 15, style: { alignment: { vertical: 'middle', horizontal: 'center' }, fill: { type: 'pattern', pattern: 'solid', fgColor:{ argb: 'cfd8dc' } } } },
      { header: '美元/新台幣', key: 'usdtwd', width: 12.5, style: { alignment: { vertical: 'middle', horizontal: 'center' }, fill: { type: 'pattern', pattern: 'solid', fgColor:{ argb: 'ffccbc' } } } },
      { header: '新台幣升貶', key: 'usdtwdChange', width: 12.5, style: { alignment: { vertical: 'middle', horizontal: 'center' }, fill: { type: 'pattern', pattern: 'solid', fgColor:{ argb: 'ffccbc' } } } },
    ];

    // 從資料庫取得大盤籌碼數據
    const data = await this.marketStatsRepository.getMarketStats(options);

    // 將資料逐列輸出至工作表
    data.forEach(row => {
      row = {
        ...row,
        taiexChangePercent: row.taiexChangePercent && numeral(row.taiexChangePercent).divide(100).value(),
        taiexTradeValue: row.taiexTradeValue && numeral(row.taiexTradeValue).divide(100000000).value(),
        finiNetBuySell: row.finiNetBuySell && numeral(row.finiNetBuySell).divide(100000000).value(),
        sitcNetBuySell: row.sitcNetBuySell && numeral(row.sitcNetBuySell).divide(100000000).value(),
        dealersNetBuySell: row.dealersNetBuySell && numeral(row.dealersNetBuySell).divide(100000000).value(),
        marginBalance: row.marginBalance && numeral(row.marginBalance).divide(100000).value(),
        marginBalanceChange: row.marginBalanceChange && numeral(row.marginBalanceChange).divide(100000).value(),
        finiTxoCallsNetOiValue: row.finiTxoCallsNetOiValue && numeral(row.finiTxoCallsNetOiValue).divide(100000).value(),
        finiTxoCallsNetOiValueChange: row.finiTxoCallsNetOiValueChange && numeral(row.finiTxoCallsNetOiValueChange).divide(100000).value(),
        finiTxoPutsNetOiValue: row.finiTxoPutsNetOiValue && numeral(row.finiTxoPutsNetOiValue).divide(100000).value(),
        finiTxoPutsNetOiValueChange: row.finiTxoPutsNetOiValueChange && numeral(row.finiTxoPutsNetOiValueChange).divide(100000).value(),
        usdtwdChange: row.usdtwdChange * -1,
      };

      // 設定工作表行列及儲存格資料格式
      const dataRow = worksheet.addRow(row);
      dataRow.getCell('date').style = { alignment: { horizontal: 'center' } };
      dataRow.getCell('taiexPrice').font = { color: { argb: getFontColorByNetChange(row.taiexChange) } };
      dataRow.getCell('taiexChange').style = { font: { color: { argb: getFontColorByNetChange(row.taiexChange) } } };
      dataRow.getCell('taiexChangePercent').style = { numFmt: '#0.00%', font: { color: { argb: getFontColorByNetChange(row.taiexChangePercent) } } };
      dataRow.getCell('taiexTradeValue').style = { numFmt: '#,##0.00' };
      dataRow.getCell('finiNetBuySell').style = { numFmt: '#,##0.00', font: { color: { argb: getFontColorByNetChange(row.finiNetBuySell) } } };
      dataRow.getCell('sitcNetBuySell').style = { numFmt: '#,##0.00', font: { color: { argb: getFontColorByNetChange(row.sitcNetBuySell) } } };
      dataRow.getCell('dealersNetBuySell').style = { numFmt: '#,##0.00', font: { color: { argb: getFontColorByNetChange(row.dealersNetBuySell) } } };
      dataRow.getCell('marginBalance').style = { numFmt: '#,##0.00' };
      dataRow.getCell('marginBalanceChange').style = { numFmt: '#,##0.00', font: { color: { argb: getFontColorByNetChange(row.marginPurchaseChange) } } };
      dataRow.getCell('shortBalance').style = { numFmt: '#,##0' };
      dataRow.getCell('shortBalanceChange').style = { numFmt: '#,##0', font: { color: { argb: getFontColorByNetChange(row.shortSaleChange) } } };
      dataRow.getCell('finiTxfNetOi').style = { numFmt: '#,##0', font: { color: { argb: getFontColorByNetChange(row.finiTxNetOi) } } };
      dataRow.getCell('finiTxfNetOiChange').style = { numFmt: '#,##0', font: { color: { argb: getFontColorByNetChange(row.finiTxNetOiChange) } } };
      dataRow.getCell('finiTxoCallsNetOiValue').style = { numFmt: '#,##0.00', font: { color: { argb: getFontColorByNetChange(row.finiTxoCallsNetOiValue) } } };
      dataRow.getCell('finiTxoCallsNetOiValueChange').style = { numFmt: '#,##0.00', font: { color: { argb: getFontColorByNetChange(row.finiTxoCallsNetOiValueChange) } } };
      dataRow.getCell('finiTxoPutsNetOiValue').style = { numFmt: '#,##0.00', font: { color: { argb: getFontColorByNetChange(row.finiTxoPutsNetOiValue) } } };
      dataRow.getCell('finiTxoPutsNetOiValueChange').style = { numFmt: '#,##0.00', font: { color: { argb: getFontColorByNetChange(row.finiTxoPutsNetOiValueChange) } } };
      dataRow.getCell('top10SpecificTxfFrontMonthNetOi').style = { numFmt: '#,##0', font: { color: { argb: getFontColorByNetChange(row.specificTop10TxFrontMonthNetOi) } } };
      dataRow.getCell('top10SpecificTxfFrontMonthNetOiChange').style = { numFmt: '#,##0', font: { color: { argb: getFontColorByNetChange(row.specificTop10TxFrontMonthNetOiChange) } } };
      dataRow.getCell('top10SpecificTxfBackMonthsNetOi').style = { numFmt: '#,##0', font: { color: { argb: getFontColorByNetChange(row.specificTop10TxBackMonthsNetOi) } } };
      dataRow.getCell('top10SpecificTxfBackMonthsNetOiChange').style = { numFmt: '#,##0', font: { color: { argb: getFontColorByNetChange(row.specificTop10TxBackMonthsNetOiChange) } } };
      dataRow.getCell('retailMxfNetOi').style = { numFmt: '#,##0', font: { color: { argb: getFontColorByNetChange(row.retailMxfNetOi) } } };
      dataRow.getCell('retailMxfNetOiChange').style = { numFmt: '#,##0', font: { color: { argb: getFontColorByNetChange(row.retailMxfNetOiChange) } } };
      dataRow.getCell('retailMtxLongShortRatio').style = { numFmt: '#0.00%', font: { color: { argb: getFontColorByNetChange(row.retailMtxLongShortRatio) } } };
      dataRow.getCell('txoPutCallRatio').style = { numFmt: '#0.00%' };
      dataRow.getCell('usdtwd').style = { numFmt: '0.000', font: { color: { argb: getFontColorByNetChange(row.usdtwdChange * -1) } }  };
      dataRow.getCell('usdtwdChange').style = { numFmt: '0.000', font: { color: { argb: getFontColorByNetChange(row.usdtwdChange * -1) } }  };
      dataRow.fill = { type: 'pattern', pattern: 'solid', fgColor: { argb: 'ffffff' } };
      dataRow.height = 20;
    });

    // 設定工作表名稱
    const date = data[0].date.replace(/-/g, '');
    worksheet.name = `${date} 大盤籌碼`;

    return workbook;
  }
}
在 addMarketStatsSheet() 方法中,需要指定 workbook 參數,代表要加入工作表的 Excel 活頁簿,並提供 options 選項參數,表示要產生特定日期的大盤籌碼資訊。
在 addMarketStatsSheet() 方法內,我們使用到 getFontColorByNetChange() 函式,這是一個工具函式,可按漲跌顯示對應的顏色,如紅漲綠跌。我們要完成 getFontColorByNetChange() 函式,請先在 src/report 目錄下建立 enums 資料夾,並在該資料夾下新增 color.enum.ts 檔案。Color 是一個列舉(enum)型別,用來定義漲跌的顏色:
export enum Color {
  Up = 'b71c1c',
  Down = '1b5e20',
  Unchanged = '000000',
}
完成後,在 src/report/enums 目錄下建立 index.ts 檔案,將 color.enum.ts 檔案匯出:
export * from './color.enum';
接著,在 src/report 目錄下建立 utils 資料夾,並在該資料夾下新增 get-font-color-by-net-change.util.ts 檔案,實作 getFontColorByNetChange() 工具函式:
import { Color } from '../enums';

export function getFontColorByNetChange(netChange: number): Color {
  if (netChange > 0) return Color.Up;
  if (netChange < 0) return Color.Down;
  return Color.Unchanged;
}
完成後,在 src/report/utils 目錄下建立 index.ts 檔案,將 get-font-color-by-net-change.util.ts 檔案匯出:
export * from './get-font-color-by-net-change.util';
然後我們就可以在 ReportService 引用這個工具函式了。
完成後,我們可以呼叫 ReportService 的 addMarketStatsSheet() 方法,在指定的 Excel 活頁簿產生大盤籌碼工作表。
在建立資金流向表之前,我們需要先實作存取產業資金流向數據的方法。
開啟 src/ticker/ticker.repository.ts 檔案,在 TickerRepository 實作 getMoneyFlow() 方法,取得上市櫃資金流向:
import { DateTime } from 'luxon';
import { find } from 'lodash';
import { Model } from 'mongoose';
import { Injectable } from '@nestjs/common';
import { InjectModel } from '@nestjs/mongoose';
import { TickerType, Market, Index } from '@speculator/common';
import { Ticker, TickerDocument } from './ticker.schema';

@Injectable()
export class TickerRepository {
  constructor(
    @InjectModel(Ticker.name) private readonly model: Model<TickerDocument>,
  ) {}

  ...

  async getMoneyFlow(options?: { date?: string, market?: Market }) {
    const date = options?.date || DateTime.local().toISODate();
    const market = options?.market || Market.TSE;

    const results = await this.model.aggregate([
      { $match: {
          date: { $lte: date },
          type: TickerType.Index,
          market: market || { $ne: null },
          symbol: { $nin: [Index.NonElectronics, Index.NonFinance, Index.NonFinanceNonElectronics] },
        },
      },
      { $project: { _id: 0, __v: 0, createdAt: 0 , updatedAt: 0 } },
      { $group: { _id: '$date', data: { $push: '$$ROOT' } } },
      { $sort: { _id: -1 } },
      { $limit: 2 },
    ]);

    const [ tickers, tickersPrev ] = results.map(doc => doc.data);

    const data = tickers.map(doc => {
      const tradeValuePrev = find(tickersPrev, { symbol: doc.symbol }).tradeValue;
      const tradeWeightPrev = find(tickersPrev, { symbol: doc.symbol }).tradeWeight;
      const tradeValueChange = parseFloat((doc.tradeValue - tradeValuePrev).toPrecision(12));
      const tradeWeightChange = parseFloat((doc.tradeWeight - tradeWeightPrev).toPrecision(12));
      return { ...doc, tradeValuePrev, tradeWeightPrev, tradeValueChange, tradeWeightChange };
    });

    return data;
  }
}
完成後,呼叫 TickerRepository 的 getMoneyFlow() 方法,並指定 date 與 market 參數選項,就可以按日期與市場別取得該日的市場資金流向。
在實作產生資料流向表的方法之前,我們需要先實作 getMarketName() 和 getSectorName() 函式,用來取得市場別和產業別名稱。
在 libs/common/src/utils 目錄下建立 get-market-name.util.ts 檔案,實作 getMarketName() 函式,將定義好的 Market 轉換成市場別名稱:
import { Market } from '../enums';

export function getMarketName(market: Market) {
  const markets = {
    [Market.TSE]: '上市',
    [Market.OTC]: '上櫃',
    [Market.ESB]: '興櫃一般板',
    [Market.TIB]: '臺灣創新板',
    [Market.PSB]: '興櫃戰略新板',
  }
  return markets[market];
}
然後在 libs/common/src/utils 目錄下建立 get-sector-name.util.ts 檔案,實作 getSectorName() 函式,用來將產業分類股價指數名稱轉換為產業別名稱:
export function getSectorName(name: string) {
  const indices = ['發行量加權股價指數', '未含金融保險股指數', '未含電子股指數', '未含金融電子股指數', '櫃檯指數'];
  return !indices.includes(name) ? name.replace('櫃檯', '').replace('類指數', '') : name;
}
完成 getMarketName() 和 getSectorName() 函式後,開啟 libs/common/src/utils/index.ts 檔案,將 get-market-name.util.ts 與 get-sector-name.util.ts 檔案一起匯出:
export * from './get-market-name.util';
export * from './get-sector-name.util';
完成後,開啟 src/report/report.service.ts 檔案,在 ReportService 實作 addMoneyFlowSheet() 方法,建立 上市櫃產業資金流向表:
import * as ExcelJS from 'exceljs';
import * as numeral from 'numeral';
import { Injectable } from '@nestjs/common';
import { Market, getMarketName, getSectorName } from '@speculator/common';
import { MarketStatsRepository } from '../market-stats/market-stats.repository';
import { TickerRepository } from '../ticker/ticker.repository';
import { getFontColorByNetChange } from './utils';

@Injectable()
export class ReportService {
  constructor(
    private readonly marketStatsRepository: MarketStatsRepository,
    private readonly tickerRepository: TickerRepository,
  ) {}

  ...

  async addMoneyFlowSheet(workbook: ExcelJS.Workbook, options: { date: string, market: Market }) {
    const worksheet = workbook.addWorksheet();

    // 設定工作表欄位格式
    worksheet.columns = [
      { header: '指數(類股)', key: 'name', width: 17.5, style: { alignment: { horizontal: 'left' }, fill: { type: 'pattern', pattern: 'solid', fgColor:{ argb: 'ffe0b2' } } } },
      { header: '指數', key: 'closePrice', width: 12.5, style: { alignment: { horizontal: 'right' }, fill: { type: 'pattern', pattern: 'solid', fgColor:{ argb: 'ffe0b2' } } } },
      { header: '漲跌', key: 'change', width: 12.5, style: { alignment: { horizontal: 'right' }, fill: { type: 'pattern', pattern: 'solid', fgColor:{ argb: 'ffe0b2' } } } },
      { header: '漲跌幅', key: 'changePercent', width: 12.5, style: { alignment: { horizontal: 'right' }, fill: { type: 'pattern', pattern: 'solid', fgColor:{ argb: 'ffe0b2' } } } },
      { header: '成交金額(億)', key: 'tradeValue', width: 12.5, style: { alignment: { horizontal: 'right' }, fill: { type: 'pattern', pattern: 'solid', fgColor:{ argb: 'ffe0b2' } } } },
      { header: '昨日金額(億)', key: 'tradeValuePrev', width: 12.5, style: { alignment: { horizontal: 'right' }, fill: { type: 'pattern', pattern: 'solid', fgColor:{ argb: 'ffe0b2' } } } },
      { header: '金額差(億)', key: 'tradeValueChange', width: 12.5, style: { alignment: { horizontal: 'right' }, fill: { type: 'pattern', pattern: 'solid', fgColor:{ argb: 'ffe0b2' } } } },
      { header: '成交比重', key: 'tradeWeight', width: 12.5, style: { alignment: { horizontal: 'right' }, fill: { type: 'pattern', pattern: 'solid', fgColor:{ argb: 'ffe0b2' } } } },
      { header: '昨日比重', key: 'tradeWeightPrev', width: 12.5, style: { alignment: { horizontal: 'right' }, fill: { type: 'pattern', pattern: 'solid', fgColor:{ argb: 'ffe0b2' } } } },
      { header: '比重差', key: 'tradeWeightChange', width: 12.5, style: { alignment: { horizontal: 'right' }, fill: { type: 'pattern', pattern: 'solid', fgColor:{ argb: 'ffe0b2' } } } },
    ];

    // 從資料庫取得產業資金流向數據
    const data = await this.tickerRepository.getMoneyFlow(options);

    // 將資料逐列輸出至工作表
    data.forEach(row => {
      row = {
        ...row,
        name: getSectorName(row.name),
        changePercent: row.changePercent && numeral(row.changePercent).divide(100).value(),
        tradeValue: row.tradeValue && numeral(row.tradeValue).divide(100000000).value(),
        tradeValuePrev: row.tradeValuePrev && numeral(row.tradeValuePrev).divide(100000000).value(),
        tradeValueChange: row.tradeValueChange && numeral(row.tradeValueChange).divide(100000000).value(),
        tradeWeight: row.tradeWeight && numeral(row.tradeWeight).divide(100).value(),
        tradeWeightPrev: row.tradeWeightPrev && numeral(row.tradeWeightPrev).divide(100).value(),
        tradeWeightChange: row.tradeWeightChange && numeral(row.tradeWeightChange).divide(100).value(),
      };

      // 設定工作表行列及儲存格資料格式
      const dataRow = worksheet.addRow(row);
      dataRow.getCell('closePrice').style = { numFmt: '##0.00', font: { color: { argb: getFontColorByNetChange(row.change) } } };
      dataRow.getCell('change').style = { numFmt: '##0.00', font: { color: { argb: getFontColorByNetChange(row.change) } } };
      dataRow.getCell('changePercent').style = { numFmt: '#0.00%', font: { color: { argb: getFontColorByNetChange(row.change) } } };
      dataRow.getCell('tradeValue').style = { numFmt: '#,##0.00' };
      dataRow.getCell('tradeValuePrev').style = { numFmt: '#,##0.00' };
      dataRow.getCell('tradeValueChange').style = { numFmt: '#,##0.00', font: { color: { argb: getFontColorByNetChange(row.tradeValueChange) } } };
      dataRow.getCell('tradeWeight').style = { numFmt: '#0.00%' };
      dataRow.getCell('tradeWeightPrev').style = { numFmt: '#0.00%' };
      dataRow.getCell('tradeWeightChange').style = { numFmt: '#0.00%', font: { color: { argb: getFontColorByNetChange(row.tradeWeightChange) } } };
      dataRow.fill = { type: 'pattern', pattern: 'solid', fgColor: { argb: 'ffffff' } };
      dataRow.height = 20;
    });

    // 設定工作表名稱
    const market = getMarketName(options.market);
    worksheet.name = `${market}資金流向`;
    worksheet.getRow(1).alignment = { vertical: 'middle', horizontal: 'center' };
    worksheet.getRow(1).height = 20;

    return workbook;
  }
}
在 addMoneyFlowSheet() 方法中,需要指定 workbook 參數,代表要加入工作表的 Excel 活頁簿,並提供 options 選項參數,可以指定 date 日期與 market 市場別,表示要產生特定日期與市場別的資金流向表。
完成後,我們可以呼叫 ReportService 的 addMoneyFlowSheet() 方法,在指定的 Excel 活頁簿產生 上市櫃產業資金流向表。
在建立資金流向表之前,我們需要先實作存取漲跌幅排行的方法。
開啟 src/ticker/ticker.repository.ts 檔案,在 TickerRepository 實作 getTopMovers() 方法,取得上市櫃個股漲跌幅排行:
import { DateTime } from 'luxon';
import { find } from 'lodash';
import { Model } from 'mongoose';
import { Injectable } from '@nestjs/common';
import { InjectModel } from '@nestjs/mongoose';
import { TickerType, Market, Index } from '@speculator/common';
import { Ticker, TickerDocument } from './ticker.schema';

@Injectable()
export class TickerRepository {
  constructor(
    @InjectModel(Ticker.name) private readonly model: Model<TickerDocument>,
  ) {}

  ...

  async getTopMovers(options?: { date?: string, market?: Market, direction?: 'up' | 'down', top?: number }) {
    const date = options?.date || DateTime.local().toISODate();
    const market = options?.market || Market.TSE;
    const direction = options?.direction || 'up';
    const top = options?.top || 50;

    const results = await this.model.aggregate([
      { $match: {
          date: { $lte: date },
          type: TickerType.Equity,
          market: market || { $ne: null },
          changePercent: (direction === 'down') ? { $lt: 0 } : { $gt: 0 },
        },
      },
      { $project: { _id: 0, __v: 0, createdAt: 0 , updatedAt: 0 } },
      { $sort: { date: -1, changePercent: (direction === 'down') ? 1 : -1 } },
      { $group: { _id: '$date', data: { $push: '$$ROOT' } } },
      { $sort: { _id: -1 } },
      { $limit: 1 },
    ]);

    const [ tickers ] = results.map(doc => doc.data);
    const data = tickers.slice(0, top);

    return data;
  }
}
完成後,開啟 src/report/report.service.ts 檔案,在 ReportService 實作 addTopMoversSheet() 方法,建立 上市櫃個股漲跌幅排行表:
import * as numeral from 'numeral';
import * as ExcelJS from 'exceljs';
import { Injectable } from '@nestjs/common';
import { Market, getMarketName, getSectorName } from '@speculator/common';
import { getFontColorByNetChange } from './utils';
import { MarketStatsRepository } from '../market-stats/market-stats.repository';
import { TickerRepository } from '../ticker/ticker.repository';

@Injectable()
export class ReportService {
  constructor(
    private readonly marketStatsRepository: MarketStatsRepository,
    private readonly tickerRepository: TickerRepository,
  ) {}

  async addTopMoversSheet(workbook: ExcelJS.Workbook, options: { date: string, market: Market }) {
    const worksheet = workbook.addWorksheet();

    // 設定工作表欄位格式
    worksheet.columns = [
      { header: '代號', key: 'gainerSymbol', width: 10 },
      { header: '股票', key: 'gainerName', width: 15 },
      { header: '股價', key: 'gainerClosePrice', width: 8, style: { alignment: { horizontal: 'right' } } },
      { header: '漲跌', key: 'gainerChange', width: 8, style: { alignment: { horizontal: 'right' } } },
      { header: '漲跌幅', key: 'gainerChangePercent', width: 8, style: { alignment: { horizontal: 'right' } } },
      { header: '成交量(張)', key: 'gainerTradeVolume', width: 12, style: { alignment: { horizontal: 'right' } } },
      { header: '', key: '', width: 8 },
      { header: '代號', key: 'loserSymbol', width: 10 },
      { header: '股票', key: 'loserName', width: 15 },
      { header: '股價', key: 'loserClosePrice', width: 8, style: { alignment: { horizontal: 'right' } } },
      { header: '漲跌', key: 'loserChange', width: 8, style: { alignment: { horizontal: 'right' } } },
      { header: '漲跌幅', key: 'loserChangePercent', width: 8, style: { alignment: { horizontal: 'right' } } },
      { header: '成交量(張)', key: 'loserTradeVolume', width: 12, style: { alignment: { horizontal: 'right' } } },
    ];

    // 從資料庫取得個股漲跌幅排行數據
    const gainers = await this.tickerRepository.getTopMovers({ ...options, direction: 'up' });
    const losers = await this.tickerRepository.getTopMovers({ ...options, direction: 'down' });
    const length = Math.max(gainers.length, losers.length);

    // 將資料逐列輸出至工作表
    Array(length).fill({}).forEach((row, i) => {
      row = {
        gainerSymbol: gainers[i]?.symbol,
        gainerName: gainers[i]?.name,
        gainerClosePrice: gainers[i]?.closePrice,
        gainerChange: gainers[i]?.change,
        gainerChangePercent: gainers[i]?.changePercent && numeral(gainers[i].changePercent).divide(100).value(),
        gainerTradeVolume: gainers[i]?.tradeVolume && numeral(gainers[i].tradeVolume).divide(1000).value(),
        loserSymbol: losers[i]?.symbol,
        loserName: losers[i]?.name,
        loserClosePrice: losers[i]?.closePrice,
        loserChange: losers[i]?.change,
        loserChangePercent: losers[i]?.changePercent && numeral(losers[i].changePercent).divide(100).value(),
        loserTradeVolume: losers[i]?.tradeVolume && numeral(losers[i].tradeVolume).divide(1000).value(),
      }

      // 設定工作表行列及儲存格資料格式
      const dataRow = worksheet.addRow(row);
      dataRow.getCell('gainerClosePrice').style = { numFmt: '#0.00', font: { color: { argb: getFontColorByNetChange(gainers[i]?.change) } } };
      dataRow.getCell('gainerChange').style = { numFmt: '#0.00', font: { color: { argb: getFontColorByNetChange(gainers[i]?.change) } } };
      dataRow.getCell('gainerChangePercent').style = { numFmt: '#0.00%', font: { color: { argb: getFontColorByNetChange(gainers[i]?.change) } } };
      dataRow.getCell('gainerTradeVolume').style = { numFmt: '#,##0' };
      dataRow.getCell('loserClosePrice').style = { numFmt: '#0.00', font: { color: { argb: getFontColorByNetChange(losers[i]?.change) } } };
      dataRow.getCell('loserChange').style = { numFmt: '#0.00', font: { color: { argb: getFontColorByNetChange(losers[i]?.change) } } };
      dataRow.getCell('loserChangePercent').style = { numFmt: '#0.00%', font: { color: { argb: getFontColorByNetChange(losers[i]?.change) } } };
      dataRow.getCell('loserTradeVolume').style = { numFmt: '#,##0' };
      dataRow.fill = { type: 'pattern', pattern: 'solid', fgColor: { argb: 'ffffff' } };
      dataRow.height = 20;
    });

    // 工作表首列格式設定
    const headerRow = worksheet.insertRow(1, ['漲幅排行', '', '', '', '', '', '', '跌幅排行', '', '', '', '', '']);
    const titleGainersCell = headerRow.getCell(1);
    const titleLosersCell = headerRow.getCell(8);
    titleGainersCell.style = { alignment: { horizontal: 'center' }, fill: { type: 'pattern', pattern: 'solid', fgColor: { argb: 'ffe0b2' } } };
    titleLosersCell.style = { alignment: { horizontal: 'center' }, fill: { type: 'pattern', pattern: 'solid', fgColor: { argb: 'ffe0b2' } } };
    worksheet.mergeCells(+titleGainersCell.row, +titleGainersCell.col, +titleGainersCell.row, +titleGainersCell.col + 5)
    worksheet.mergeCells(+titleLosersCell.row, +titleLosersCell.col, +titleLosersCell.row, +titleLosersCell.col + 5)
    headerRow.alignment = { vertical: 'middle', horizontal: 'center' };
    headerRow.height = 20;

    // 設定工作表名稱
    const market = getMarketName(options.market);
    worksheet.name = `${market}漲跌幅排行`;
    worksheet.getRow(2).fill = { type: 'pattern', pattern: 'solid', fgColor: { argb: 'ffffff' } };

    return workbook;
  }
}
在 addTopMoversSheet() 方法中,需要指定 workbook 參數,代表要加入工作表的 Excel 活頁簿,並提供 options 選項參數,可以指定 date 日期與 market 市場別,表示要產生特定日期與市場別的個股漲跌幅排行表。
完成後,我們可以呼叫 ReportService 的 addTopMoversSheet() 方法,在指定的 Excel 活頁簿產生 上市櫃個股漲跌幅排行表。
在建立資金流向表之前,我們需要先實作存取成交量值排行的方法。
開啟 src/ticker/ticker.repository.ts 檔案,在 TickerRepository 實作 getMostActives() 方法,取得上市櫃個股成交量值排行:
import { DateTime } from 'luxon';
import { find } from 'lodash';
import { Model } from 'mongoose';
import { Injectable } from '@nestjs/common';
import { InjectModel } from '@nestjs/mongoose';
import { TickerType, Market, Index } from '@speculator/common';
import { Ticker, TickerDocument } from './ticker.schema';

@Injectable()
export class TickerRepository {
  constructor(
    @InjectModel(Ticker.name) private readonly model: Model<TickerDocument>,
  ) {}

  ...

  async getMostActives(options?: { date?: string, market?: Market, trade?: 'volume' | 'value', top?: number }) {
    const date = options?.date || DateTime.local().toISODate();
    const market = options?.market || Market.TSE;
    const trade = options?.trade || 'volume';
    const key = (trade === 'value') ? 'tradeValue' : 'tradeVolume';
    const top = options?.top || 50;

    const results = await this.model.aggregate([
      { $match: {
          date: { $lte: date },
          type: TickerType.Equity,
          market: market || { $ne: null },
        },
      },
      { $project: { _id: 0, __v: 0, createdAt: 0 , updatedAt: 0 } },
      { $sort: { date: -1, [key]: -1 } },
      { $group: { _id: '$date', data: { $push: '$$ROOT' } } },
      { $sort: { _id: -1 } },
      { $limit: 1 },
    ]);

    const [ tickers ] = results.map(doc => doc.data);
    const data = tickers.slice(0, top);

    return data;
  }
}
完成後,開啟 src/report/report.service.ts 檔案,在 ReportService 實作 addMostActivesSheet() 方法,建立 上市櫃個股成交量值排行表:
import * as numeral from 'numeral';
import * as ExcelJS from 'exceljs';
import { Injectable } from '@nestjs/common';
import { Market, getMarketName, getSectorName } from '@speculator/common';
import { getFontColorByNetChange } from './utils';
import { MarketStatsRepository } from '../market-stats/market-stats.repository';
import { TickerRepository } from '../ticker/ticker.repository';

@Injectable()
export class ReportService {
  constructor(
    private readonly marketStatsRepository: MarketStatsRepository,
    private readonly tickerRepository: TickerRepository,
  ) {}

  ...

  async addMostActivesSheet(workbook: ExcelJS.Workbook, options: { date: string, market: Market }) {
    const worksheet = workbook.addWorksheet();

    // 設定工作表欄位格式
    worksheet.columns = [
      { header: '代號', key: 'volumeSymbol', width: 10 },
      { header: '股票', key: 'volumeName', width: 15 },
      { header: '股價', key: 'volumeClosePrice', width: 8, style: { alignment: { horizontal: 'right' } } },
      { header: '漲跌', key: 'volumeChange', width: 8, style: { alignment: { horizontal: 'right' } } },
      { header: '漲跌幅', key: 'volumeChangePercent', width: 8, style: { alignment: { horizontal: 'right' } } },
      { header: '成交量(張)', key: 'volumeTradeVolume', width: 12, style: { alignment: { horizontal: 'right' } } },
      { header: '', key: '', width: 8 },
      { header: '代號', key: 'valueSymbol', width: 10 },
      { header: '股票', key: 'valueName', width: 15 },
      { header: '股價', key: 'valueClosePrice', width: 8, style: { alignment: { horizontal: 'right' } } },
      { header: '漲跌', key: 'valueChange', width: 8, style: { alignment: { horizontal: 'right' } } },
      { header: '漲跌幅', key: 'valueChangePercent', width: 8, style: { alignment: { horizontal: 'right' } } },
      { header: '成交值(億)', key: 'valueTradeValue', width: 12, style: { alignment: { horizontal: 'right' } } },
    ];

    // 從資料庫取得個股成交量值排行數據
    const mostActivesByVolume = await this.tickerRepository.getMostActives({ ...options, trade: 'volume' });
    const mostActivesByValue = await this.tickerRepository.getMostActives({ ...options, trade: 'value' });
    const length = mostActivesByVolume.length;

    // 將資料逐列輸出至工作表
    Array(length).fill({}).forEach((row, i) => {
      row = {
        volumeSymbol: mostActivesByVolume[i]?.symbol,
        volumeName: mostActivesByVolume[i]?.name,
        volumeClosePrice: mostActivesByVolume[i]?.closePrice,
        volumeChange: mostActivesByVolume[i]?.change,
        volumeChangePercent: mostActivesByVolume[i]?.changePercent && numeral(mostActivesByVolume[i].changePercent).divide(100).value(),
        volumeTradeVolume: mostActivesByVolume[i]?.tradeVolume && numeral(mostActivesByVolume[i].tradeVolume).divide(1000).value(),
        valueSymbol: mostActivesByValue[i]?.symbol,
        valueName: mostActivesByValue[i]?.name,
        valueClosePrice: mostActivesByValue[i]?.closePrice,
        valueChange: mostActivesByValue[i]?.change,
        valueChangePercent: mostActivesByValue[i]?.changePercent && numeral(mostActivesByValue[i].changePercent).divide(100).value(),
        valueTradeValue: mostActivesByValue[i]?.tradeValue && numeral(mostActivesByValue[i].tradeValue).divide(100000000).value(),
      }

      // 設定工作表行列及儲存格資料格式
      const dataRow = worksheet.addRow(row);
      dataRow.getCell('volumeClosePrice').style = { numFmt: '#0.00', font: { color: { argb: getFontColorByNetChange(mostActivesByVolume[i]?.change) } } };
      dataRow.getCell('volumeChange').style = { numFmt: '#0.00', font: { color: { argb: getFontColorByNetChange(mostActivesByVolume[i]?.change) } } };
      dataRow.getCell('volumeChangePercent').style = { numFmt: '#0.00%', font: { color: { argb: getFontColorByNetChange(mostActivesByVolume[i]?.change) } } };
      dataRow.getCell('volumeTradeVolume').style = { numFmt: '#,##0' };
      dataRow.getCell('valueClosePrice').style = { numFmt: '#0.00', font: { color: { argb: getFontColorByNetChange(mostActivesByValue[i]?.change) } } };
      dataRow.getCell('valueChange').style = { numFmt: '#0.00', font: { color: { argb: getFontColorByNetChange(mostActivesByValue[i]?.change) } } };
      dataRow.getCell('valueChangePercent').style = { numFmt: '#0.00%', font: { color: { argb: getFontColorByNetChange(mostActivesByValue[i]?.change) } } };
      dataRow.getCell('valueTradeValue').style = { numFmt: '#,##0.00' };
      dataRow.fill = { type: 'pattern', pattern: 'solid', fgColor: { argb: 'ffffff' } };
      dataRow.height = 20;
    });

    // 工作表首列格式設定
    const headerRow = worksheet.insertRow(1, ['成交量排行', '', '', '', '', '', '', '成交值排行', '', '', '', '', '']);
    const titleMostActivesByVolumeCell = headerRow.getCell(1);
    const titleMostActivesByValueCell = headerRow.getCell(8);
    titleMostActivesByVolumeCell.style = { alignment: { horizontal: 'center' }, fill: { type: 'pattern', pattern: 'solid', fgColor: { argb: 'ffe0b2' } } };
    titleMostActivesByValueCell.style = { alignment: { horizontal: 'center' }, fill: { type: 'pattern', pattern: 'solid', fgColor: { argb: 'ffe0b2' } } };
    worksheet.mergeCells(+titleMostActivesByVolumeCell.row, +titleMostActivesByVolumeCell.col, +titleMostActivesByVolumeCell.row, +titleMostActivesByVolumeCell.col + 5)
    worksheet.mergeCells(+titleMostActivesByValueCell.row, +titleMostActivesByValueCell.col, +titleMostActivesByValueCell.row, +titleMostActivesByValueCell.col + 5)
    headerRow.alignment = { vertical: 'middle', horizontal: 'center' };
    headerRow.height = 20;

    // 設定工作表名稱
    const market = getMarketName(options.market);
    worksheet.name = `${market}成交量值排行`;
    worksheet.getRow(2).fill = { type: 'pattern', pattern: 'solid', fgColor: { argb: 'ffffff' } };

    return workbook;
  }
}
在 addMostActivesSheet() 方法中,需要指定 workbook 參數,代表要加入工作表的 Excel 活頁簿,並提供 options 選項參數,可以指定 date 日期與 market 市場別,表示要產生特定日期與市場別的個股成交量值排行表。
完成後,我們可以呼叫 ReportService 的 addMostActivesSheet() 方法,在指定的 Excel 活頁簿產生 上市櫃個股成交量值排行表。
在建立外資投信買賣超排行表之前,我們需要先實作存取外資投信買賣超排行的方法。
開啟 src/ticker/ticker.repository.ts 檔案,在 TickerRepository 實作 getInstInvestorsTrades() 方法,取得上市櫃個股外資投信買賣超排行:
import { DateTime } from 'luxon';
import { find } from 'lodash';
import { Model } from 'mongoose';
import { Injectable } from '@nestjs/common';
import { InjectModel } from '@nestjs/mongoose';
import { TickerType, Market, Index } from '@speculator/common';
import { Ticker, TickerDocument } from './ticker.schema';

@Injectable()
export class TickerRepository {
  constructor(
    @InjectModel(Ticker.name) private readonly model: Model<TickerDocument>,
  ) {}

  ...

  async getInstInvestorsTrades(options?: { date?: string, market?: Market, inst?: 'fini' | 'sitc' | 'dealers', net: 'buy' | 'sell', top?: number }) {
    const date = options?.date || DateTime.local().toISODate();
    const market = options?.market || Market.TSE;
    const inst = options?.inst || `fini`;
    const net = options?.net || 'buy';
    const top = options?.top || 50;
    const instKey = `${inst}NetBuySell`;

    const results = await this.model.aggregate([
      { $match: {
          date: { $lte: date },
          type: TickerType.Equity,
          market: market || { $ne: null },
          [instKey]: (net === 'sell') ? { $lt: 0 } : { $gt: 0 },
        },
      },
      { $project: { _id: 0, __v: 0, createdAt: 0 , updatedAt: 0 } },
      { $sort: { date: -1, [instKey]: (net === 'sell') ? 1 : -1 } },
      { $group: { _id: '$date', data: { $push: '$$ROOT' } } },
      { $sort: { _id: -1 } },
      { $limit: 1 },
    ]);

    const [ tickers ] = results.map(doc => doc.data);
    const data = tickers.slice(0, top);

    return data;
  }
}
完成後,開啟 src/report/report.service.ts 檔案,在 ReportService 實作 addInstInvestorsTradesSheet() 方法,建立 上市櫃個股外資投信買賣超排行表:
import * as ExcelJS from 'exceljs';
import * as numeral from 'numeral';
import { Injectable } from '@nestjs/common';
import { Market, getMarketName, getSectorName } from '@speculator/common';
import { MarketStatsRepository } from '../market-stats/market-stats.repository';
import { TickerRepository } from '../ticker/ticker.repository';
import { getFontColorByNetChange } from './utils';

@Injectable()
export class ReportService {
  constructor(
    private readonly marketStatsRepository: MarketStatsRepository,
    private readonly tickerRepository: TickerRepository,
  ) {}

  ...

  async addInstInvestorsTradesSheet(workbook: ExcelJS.Workbook, options: { date: string, market: Market }) {
    const worksheet = workbook.addWorksheet();

    // 設定工作表欄位格式
    worksheet.columns = [
      { header: '代號', key: 'finiNetBuySymbol', width: 10 },
      { header: '股票', key: 'finiNetBuyName', width: 15 },
      { header: '張數', key: 'finiNetBuyVolume', width: 10, style: { alignment: { horizontal: 'right' } } },
      { header: '股價', key: 'finiNetBuyClosePrice', width: 8, style: { alignment: { horizontal: 'right' } } },
      { header: '漲跌幅', key: 'finiNetBuyChangePercent', width: 8, style: { alignment: { horizontal: 'right' } } },
      { header: '成交量(張)', key: 'finiNetBuyTotalVolume', width: 12, style: { alignment: { horizontal: 'right' } } },
      { header: '', key: '', width: 8 },
      { header: '代號', key: 'finiNetSellSymbol', width: 10 },
      { header: '股票', key: 'finiNetSellName', width: 15 },
      { header: '張數', key: 'finiNetSellVolume', width: 10, style: { alignment: { horizontal: 'right' } } },
      { header: '股價', key: 'finiNetSellClosePrice', width: 8, style: { alignment: { horizontal: 'right' } } },
      { header: '漲跌幅', key: 'finiNetSellChangePercent', width: 8, style: { alignment: { horizontal: 'right' } } },
      { header: '成交量(張)', key: 'finiNetSellTotalVolume', width: 12, style: { alignment: { horizontal: 'right' } } },
      { header: '', key: '', width: 8 },
      { header: '代號', key: 'sitcNetBuySymbol', width: 10 },
      { header: '股票', key: 'sitcNetBuyName', width: 15 },
      { header: '張數', key: 'sitcNetBuyVolume', width: 10, style: { alignment: { horizontal: 'right' } } },
      { header: '股價', key: 'sitcNetBuyClosePrice', width: 8, style: { alignment: { horizontal: 'right' } } },
      { header: '漲跌幅', key: 'sitcNetBuyChangePercent', width: 8, style: { alignment: { horizontal: 'right' } } },
      { header: '成交量(張)', key: 'sitcNetBuyTotalVolume', width: 12, style: { alignment: { horizontal: 'right' } } },
      { header: '', key: '', width: 8 },
      { header: '代號', key: 'sitcNetSellSymbol', width: 10 },
      { header: '股票', key: 'sitcNetSellName', width: 15 },
      { header: '張數', key: 'sitcNetSellVolume', width: 10, style: { alignment: { horizontal: 'right' } } },
      { header: '股價', key: 'sitcNetSellClosePrice', width: 8, style: { alignment: { horizontal: 'right' } } },
      { header: '漲跌幅', key: 'sitcNetSellChangePercent', width: 8, style: { alignment: { horizontal: 'right' } } },
      { header: '成交量(張)', key: 'sitcNetSellTotalVolume', width: 12, style: { alignment: { horizontal: 'right' } } },
    ];

    // 從資料庫取得個股外資投信買賣超排行數據
    const finiNetBuyList = await this.tickerRepository.getInstInvestorsTrades({ ...options, inst: 'fini', net: 'buy' });
    const finiNetSellList = await this.tickerRepository.getInstInvestorsTrades({ ...options, inst: 'fini', net: 'sell' });
    const sitcNetBuyList = await this.tickerRepository.getInstInvestorsTrades({ ...options, inst: 'sitc', net: 'buy' });
    const sitcNetSellList = await this.tickerRepository.getInstInvestorsTrades({ ...options, inst: 'sitc', net: 'sell' });
    const length = Math.max(finiNetBuyList.length, finiNetSellList.length, sitcNetBuyList.length, sitcNetSellList.length);

    // 將資料逐列輸出至工作表
    Array(length).fill({}).forEach((row, i) => {
      row = {
        finiNetBuySymbol: finiNetBuyList[i]?.symbol,
        finiNetBuyName: finiNetBuyList[i]?.name,
        finiNetBuyVolume: finiNetBuyList[i]?.finiNetBuySell && numeral(finiNetBuyList[i].finiNetBuySell).divide(1000).value(),
        finiNetBuyClosePrice: finiNetBuyList[i]?.closePrice,
        finiNetBuyChangePercent: finiNetBuyList[i]?.changePercent && numeral(finiNetBuyList[i].changePercent).divide(100).value(),
        finiNetBuyTotalVolume: finiNetBuyList[i]?.tradeVolume && numeral(finiNetBuyList[i].tradeVolume).divide(1000).value(),
        finiNetSellSymbol: finiNetSellList[i]?.symbol,
        finiNetSellName: finiNetSellList[i]?.name,
        finiNetSellVolume: finiNetSellList[i]?.finiNetBuySell && numeral(finiNetSellList[i].finiNetBuySell).divide(1000).value(),
        finiNetSellClosePrice: finiNetSellList[i]?.closePrice,
        finiNetSellChangePercent: finiNetSellList[i]?.changePercent && numeral(finiNetSellList[i].changePercent).divide(100).value(),
        finiNetSellTotalVolume: finiNetSellList[i]?.tradeVolume && numeral(finiNetSellList[i].tradeVolume).divide(1000).value(),
        sitcNetBuySymbol: sitcNetBuyList[i]?.symbol,
        sitcNetBuyName: sitcNetBuyList[i]?.name,
        sitcNetBuyVolume: sitcNetBuyList[i]?.finiNetBuySell && numeral(sitcNetBuyList[i].sitcNetBuySell).divide(1000).value(),
        sitcNetBuyClosePrice: sitcNetBuyList[i]?.closePrice,
        sitcNetBuyChangePercent: sitcNetBuyList[i]?.changePercent && numeral(sitcNetBuyList[i].changePercent).divide(100).value(),
        sitcNetBuyTotalVolume: sitcNetBuyList[i]?.tradeVolume && numeral(sitcNetBuyList[i].tradeVolume).divide(1000).value(),
        sitcNetSellSymbol: sitcNetSellList[i]?.symbol,
        sitcNetSellName: sitcNetSellList[i]?.name,
        sitcNetSellVolume: sitcNetSellList[i]?.finiNetBuySell && numeral(sitcNetSellList[i].sitcNetBuySell).divide(1000).value(),
        sitcNetSellClosePrice: sitcNetSellList[i]?.closePrice,
        sitcNetSellChangePercent: sitcNetSellList[i]?.changePercent && numeral(sitcNetSellList[i].changePercent).divide(100).value(),
        sitcNetSellTotalVolume: sitcNetSellList[i]?.tradeVolume && numeral(sitcNetSellList[i].tradeVolume).divide(1000).value(),
      }

      // 設定工作表行列及儲存格資料格式
      const dataRow = worksheet.addRow(row);
      dataRow.getCell('finiNetBuyVolume').style = { numFmt: '#,##0' };
      dataRow.getCell('finiNetBuyClosePrice').style = { numFmt: '#0.00', font: { color: { argb: getFontColorByNetChange(finiNetBuyList[i]?.change) } } };
      dataRow.getCell('finiNetBuyChangePercent').style = { numFmt: '#0.00%', font: { color: { argb: getFontColorByNetChange(finiNetBuyList[i]?.change) } } };
      dataRow.getCell('finiNetBuyTotalVolume').style = { numFmt: '#,##0' };
      dataRow.getCell('finiNetSellVolume').style = { numFmt: '#,##0' };
      dataRow.getCell('finiNetSellClosePrice').style = { numFmt: '#0.00', font: { color: { argb: getFontColorByNetChange(finiNetSellList[i]?.change) } } };
      dataRow.getCell('finiNetSellChangePercent').style = { numFmt: '#0.00%', font: { color: { argb: getFontColorByNetChange(finiNetSellList[i]?.change) } } };
      dataRow.getCell('finiNetSellTotalVolume').style = { numFmt: '#,##0' };
      dataRow.getCell('sitcNetBuyVolume').style = { numFmt: '#,##0' };
      dataRow.getCell('sitcNetBuyClosePrice').style = { numFmt: '#0.00', font: { color: { argb: getFontColorByNetChange(sitcNetBuyList[i]?.change) } } };
      dataRow.getCell('sitcNetBuyChangePercent').style = { numFmt: '#0.00%', font: { color: { argb: getFontColorByNetChange(sitcNetBuyList[i]?.change) } } };
      dataRow.getCell('sitcNetBuyTotalVolume').style = { numFmt: '#,##0' };
      dataRow.getCell('sitcNetSellVolume').style = { numFmt: '#,##0' };
      dataRow.getCell('sitcNetSellClosePrice').style = { numFmt: '#0.00', font: { color: { argb: getFontColorByNetChange(sitcNetSellList[i]?.change) } } };
      dataRow.getCell('sitcNetSellChangePercent').style = { numFmt: '#0.00%', font: { color: { argb: getFontColorByNetChange(sitcNetSellList[i]?.change) } } };
      dataRow.getCell('sitcNetSellTotalVolume').style = { numFmt: '#,##0' };
      dataRow.fill = { type: 'pattern', pattern: 'solid', fgColor: { argb: 'ffffff' } };
      dataRow.height = 20;
    });

    // 工作表首列格式設定
    const headerRow = worksheet.insertRow(1, ['外資買超', '', '', '', '', '', '', '外資賣超', '', '', '', '', '', '', '投信買超', '', '', '', '', '', '', '投信賣超', '', '', '', '', '']);
    const titlefiniNetBuyCell = headerRow.getCell(1);
    const titlefiniNetSellCell = headerRow.getCell(8);
    const titleSticNetBuyCell = headerRow.getCell(15);
    const titlesitcNetSellCell = headerRow.getCell(22);
    titlefiniNetBuyCell.style = { alignment: { horizontal: 'center' }, fill: { type: 'pattern', pattern: 'solid', fgColor:{ argb: 'ffe0b2' } } };
    titlefiniNetSellCell.style = { alignment: { horizontal: 'center' }, fill: { type: 'pattern', pattern: 'solid', fgColor:{ argb: 'ffe0b2' } } };
    titleSticNetBuyCell.style = { alignment: { horizontal: 'center' }, fill: { type: 'pattern', pattern: 'solid', fgColor:{ argb: 'ffe0b2' } } };
    titlesitcNetSellCell.style = { alignment: { horizontal: 'center' }, fill: { type: 'pattern', pattern: 'solid', fgColor:{ argb: 'ffe0b2' } } };
    worksheet.mergeCells(+titlefiniNetBuyCell.row, +titlefiniNetBuyCell.col, +titlefiniNetBuyCell.row, +titlefiniNetBuyCell.col + 5)
    worksheet.mergeCells(+titlefiniNetSellCell.row, +titlefiniNetSellCell.col, +titlefiniNetSellCell.row, +titlefiniNetSellCell.col + 5)
    worksheet.mergeCells(+titleSticNetBuyCell.row, +titleSticNetBuyCell.col, +titleSticNetBuyCell.row, +titleSticNetBuyCell.col + 5)
    worksheet.mergeCells(+titlesitcNetSellCell.row, +titlesitcNetSellCell.col, +titlesitcNetSellCell.row, +titlesitcNetSellCell.col + 5)
    headerRow.alignment = { vertical: 'middle', horizontal: 'center' };
    headerRow.height = 20;

    // 設定工作表名稱
    const market = getMarketName(options.market);
    worksheet.name = `${market}外資投信買賣超排行`;
    worksheet.getRow(2).fill = { type: 'pattern', pattern: 'solid', fgColor: { argb: 'ffffff' } };
  }
}
在 addInstInvestorsTradesSheet() 方法中,需要指定 workbook 參數,代表要加入工作表的 Excel 活頁簿,並提供 options 選項參數,可以指定 date 日期與 market 市場別,表示要產生特定日期與市場別的個股外資投信買賣超排行表。
完成後,我們可以呼叫 ReportService 的 addInstInvestorsTradesSheet() 方法,在指定的 Excel 活頁簿產生 上市櫃個股外資投信買賣超排行表。
完成包含 大盤籌碼工作表、上市櫃產業資金流向表、上市櫃個股漲跌幅排行表、上市櫃個股成交量值排行表 以及 上市櫃個股外資投信買賣超排行表 等工作表的建立方法後,我們要將 Excel 活頁簿匯出成檔案。
開啟 src/market-stats/market-stats.service.ts 檔案,在 ReportService 實作 export() 方法,匯出 Excel 活頁簿:
import * as ExcelJS from 'exceljs';
import * as numeral from 'numeral';
import { Injectable } from '@nestjs/common';
import { Market, getMarketName, getSectorName } from '@speculator/common';
import { MarketStatsRepository } from '../market-stats/market-stats.repository';
import { TickerRepository } from '../ticker/ticker.repository';
import { getFontColorByNetChange } from './utils';

@Injectable()
export class ReportService {
  constructor(
    private readonly marketStatsRepository: MarketStatsRepository,
    private readonly tickerRepository: TickerRepository,
  ) {}

  async export(options: { date: string }): Promise<ExcelJS.Buffer> {
    const workbook = await this.createWorkbook();
    await this.addMarketStatsSheet(workbook, options);
    await this.addMoneyFlowSheet(workbook, { date: options.date, market: Market.TSE });
    await this.addMoneyFlowSheet(workbook, { date: options.date, market: Market.OTC });
    await this.addTopMoversSheet(workbook, { date: options.date, market: Market.TSE });
    await this.addTopMoversSheet(workbook, { date: options.date, market: Market.OTC });
    await this.addMostActivesSheet(workbook, { date: options.date, market: Market.TSE });
    await this.addMostActivesSheet(workbook, { date: options.date, market: Market.OTC });
    await this.addInstInvestorsTradesSheet(workbook, { date: options.date, market: Market.TSE });
    await this.addInstInvestorsTradesSheet(workbook, { date: options.date, market: Market.OTC });
    return workbook.xlsx.writeBuffer();
  }

  ...
}
完成後,我們可以呼叫 ReportService 的 export() 方法,就可以輸出我們的市場觀察報告。
為了方便查看結果,我們可以在開發時加入 onApplicationBootstrap() 這個 lifecyle hook 進行測試。我們指定的報告日期為 2022-07-01,並輸出 20220701.xlsx 檔案:
...
@Injectable()
export class ReportService {
  constructor(
    private readonly marketStatsRepository: MarketStatsRepository,
    private readonly tickerRepository: TickerRepository,
  ) {}

  async onApplicationBootstrap() {
    const buffer = await this.export({ date: '2022-07-01' }) as NodeJS.ArrayBufferView;
    fs.writeFileSync('20220701.xlsx', buffer);
  }

  ...
}
然後打開終端機輸入以下指令執行應用程式:
$ npm run start:dev
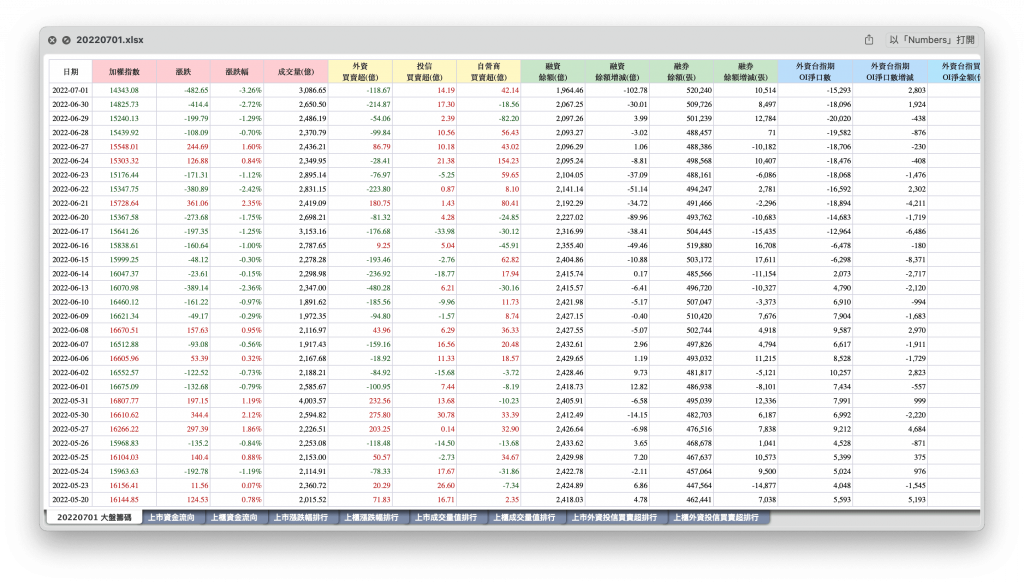
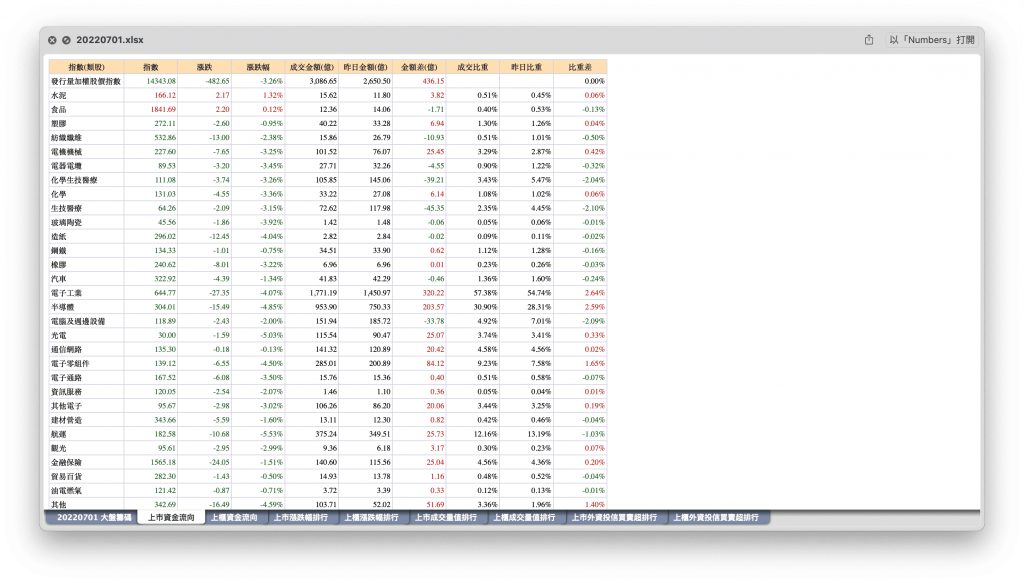
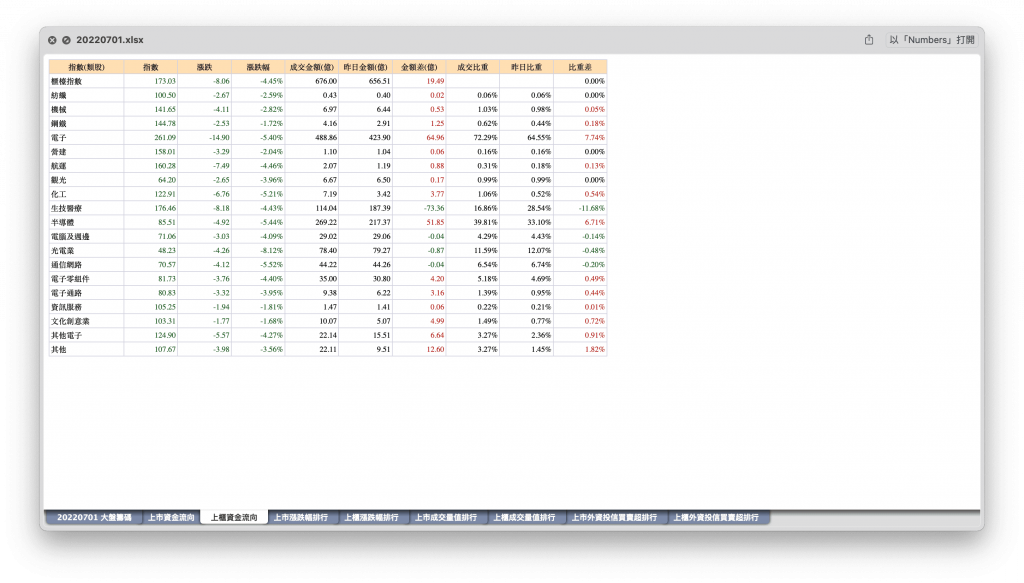
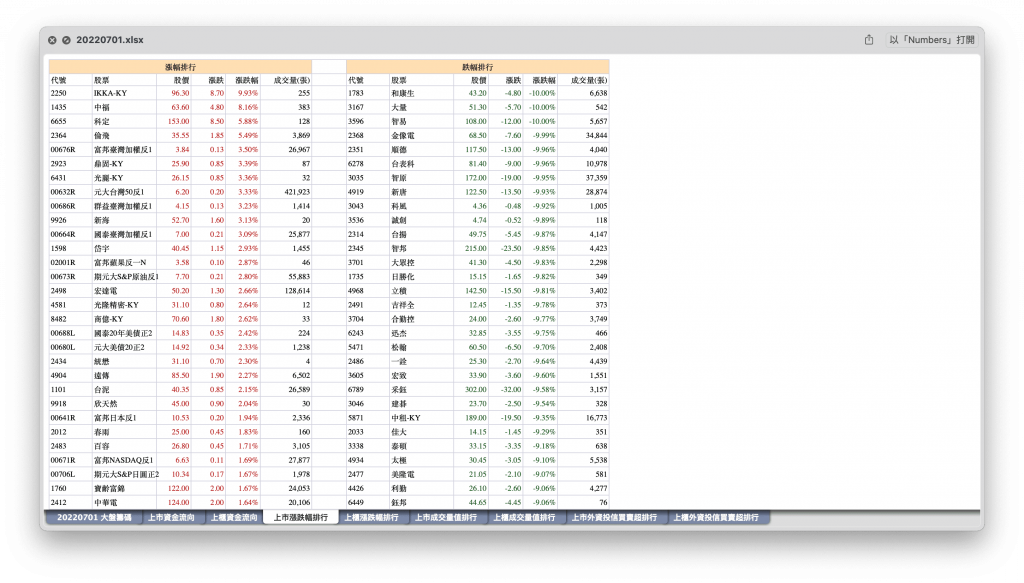
我們以報告日期 2022-07-01 為例,scraper 應用程式會在專案目錄下產生 20220701.xlsx 檔案,以下是在 Mac 上的「預覽程式」下顯示的結果。
大盤籌碼:
上市資金流向:
上櫃資金流向:
上市漲跌幅排行:
上櫃漲跌幅排行:
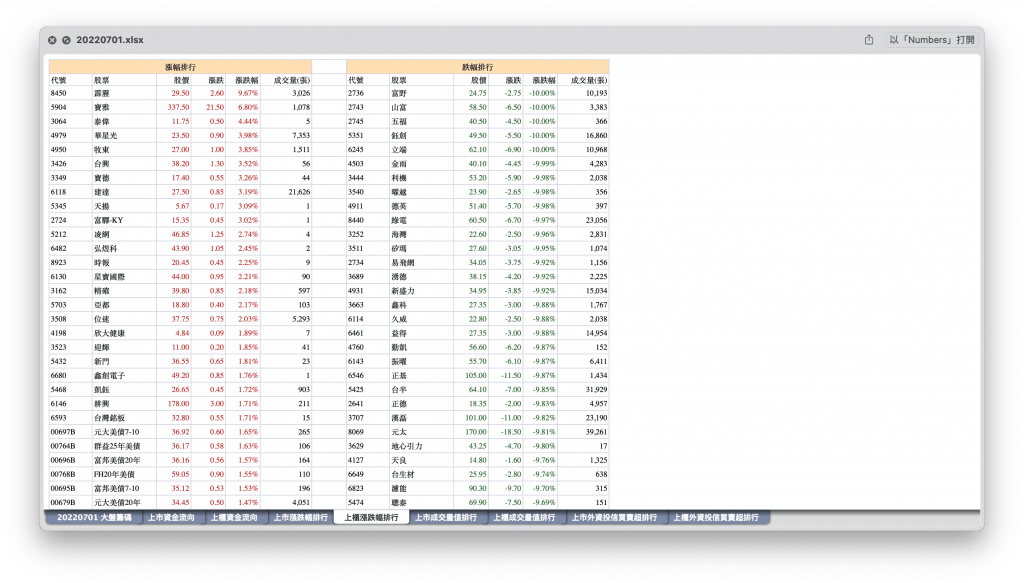
上市成交量值排行:
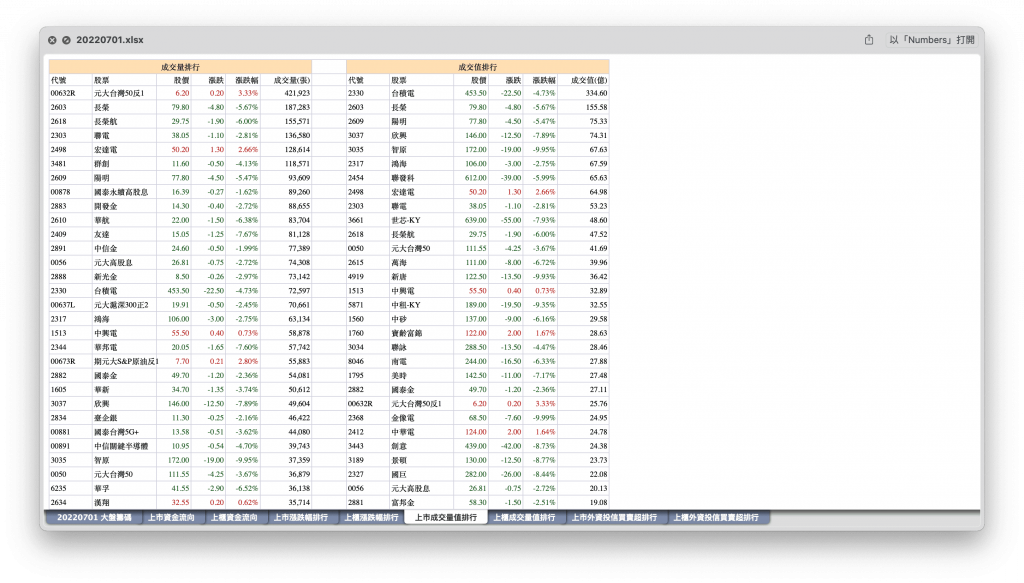
上櫃成交量值排行:
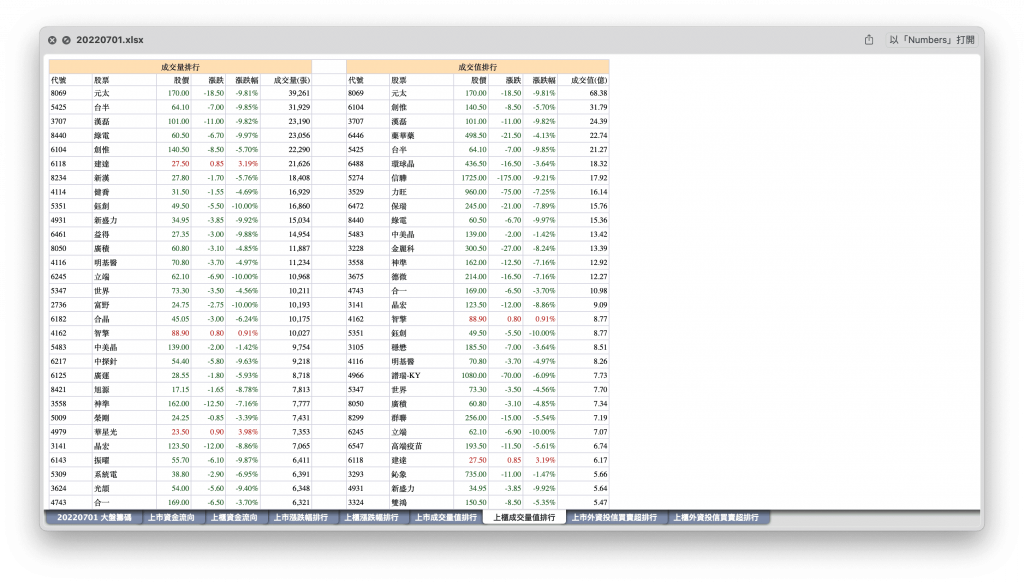
上市外資投信買賣超排行:
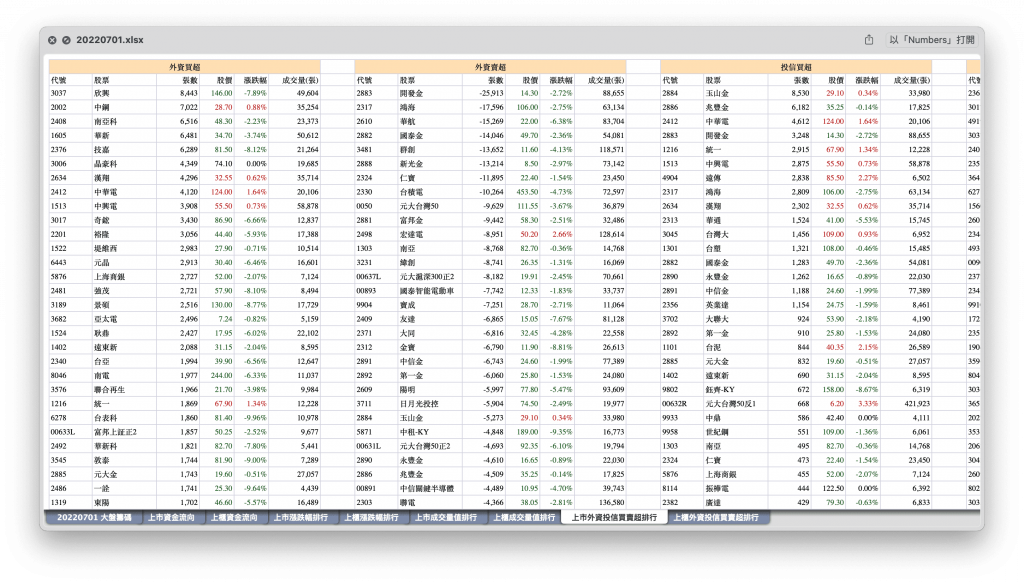
上櫃外資投信買賣超排行:
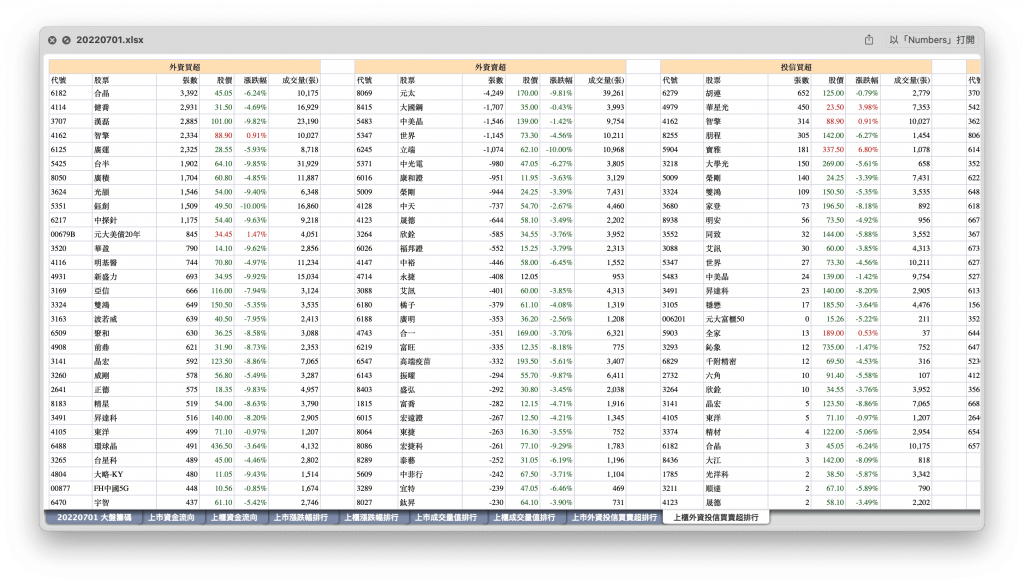
至此,我們已經完成了「Report Module」產生盤後報告的方式,並以 Excel 檔案輸出。明天將介紹如何透過 Gmail SMTP 並使用排程任務,在指定時間將產出的市場觀察報告寄至我們的電子郵件地址。
註:本文的程式碼內容因排版問題比較不容易閱讀,筆者會在完成 30 天系列文後,提供完整的程式範例。
exceljs 建立 Excel 活頁簿與工作表。exceljs 建立的活頁簿輸出成 Excel 檔案。
本系列文已正式出版為《Node.js 量化投資全攻略:從資料收集到自動化交易系統建構實戰》。本書新增了全新內容和實用範例,為你提供更深入的學習體驗!歡迎參考選購,開始你的量化投資之旅!
天瓏網路書店連結:https://www.tenlong.com.tw/products/9786263336070
