Prometheus 作為現在 Observability 受歡迎的 Solution 之一,究竟它帶來了什麼樣的好處?本篇就來跟大家介紹一下。

Prometheus 為 cncf 畢業專案,是一套用於監控與警報的開源軟體,會將即時的 Metrics 資料儲存到時間序列資料庫,並透過 HTTP 接口讓使用者查詢以及設定預警規則,讓我們能輕鬆管理 Metrics 。
Prometheus 可視為管理 Metrics 資料的工具,包含蒐集並儲存 Metrics 資料,提供資料搜尋的 API ,並結合示警功能及可視化工具。
Prometheus 包含以下元件
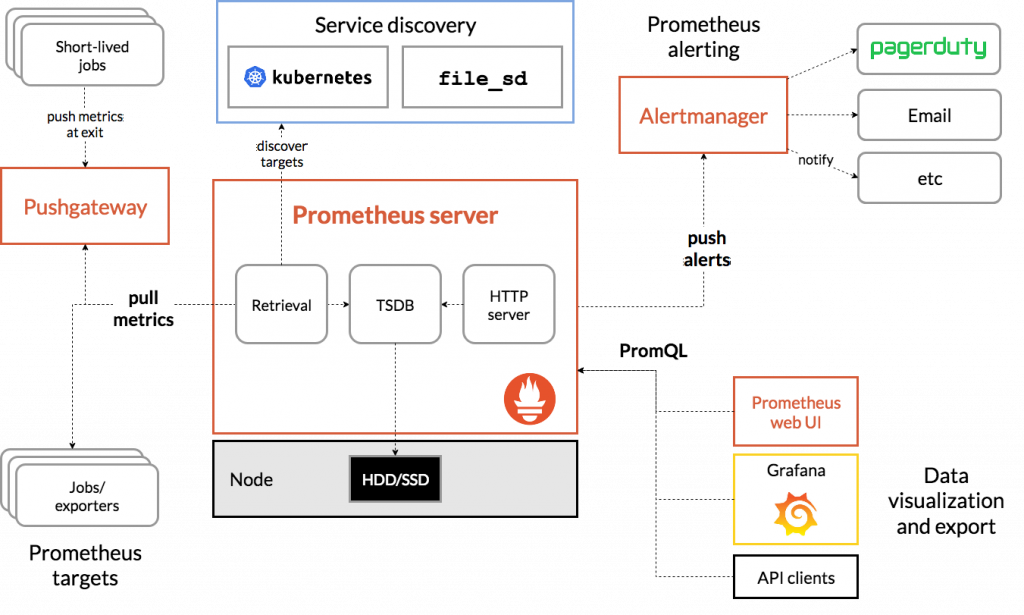
Prometheus 架構圖,圖片取至 prometheus.io
在上一篇有提到 Metrics 代表系統中的數值資料,在 Prometheus 又細分為四種不同的 Metric Types
Counter 為一個累積用的 Metrics,只能被增加或者被設為0,常被用來計算請求總數、錯誤次數等等
Counter Example
10:00 http_requests_total=1
10:01 http_requests_total=5
10:02 http_requests_total=8
Gauge 代表單一數值的 Metrics,可以任意的上升或下降,如伺服器溫度、磁碟使用量
Gauge Example
10:00 node_memory_MemFree=50
10:01 node_memory_MemFree=55
10:02 node_memory_MemFree=53
Histogram 與 Summary 儲存的皆為一段時間的統計資料,可用作為直方圖數據的顯示
四種 metrics 的詳細介紹,可參考 Metric Types
PromQL (Prometheus Query Language) 為 Prometheus 開發的數據查詢語言,使用者可以下達 PromQL 查詢語句來獲取 Prometheus 內部的資訊,有很多函數可以使用,以下是一些例子
# 查詢 http_requests_total,Code 為 200 的資料
http_requests_total{code="200"}

# 查詢 http_requests_total,Code 為 200 資料的平均值
avg(http_requests_total{code="200"})

# 5分鐘內 http_requests_total 資料的平均值
rate(http_requests_total[5m])
PromQL 可以想像成 Prometheus 版本的 SQL 查詢語言
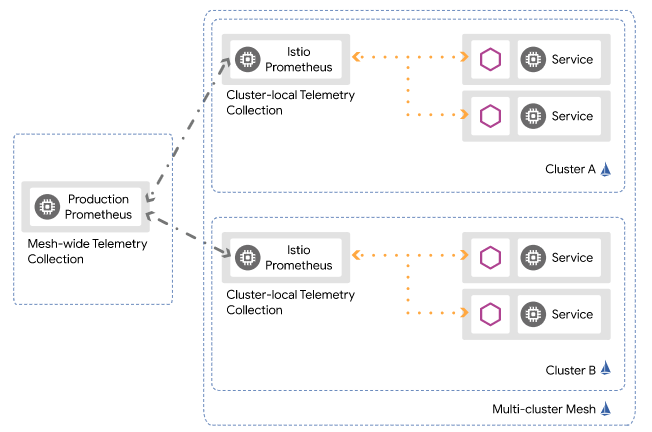
使用 Istio 會在每個 Pod 都建立一個 Sidecar,使用者不需額外撰寫 Metrics 相關邏輯,Sidecar 就能主動蒐集應用程式的 Metrics ,並將資料送至 Prometheus。
本篇了解完 Prometheus 是用來做什麼的,下一篇就會在 Istio 實際使用,並會學習如何下達 PromQL 語句來獲取應用程式的 Metrics 資料。