經過前面都是使用觀測資料,今天開始使用預報資料。
一樣在氣象局開放自料下載所需資料。
但預報資料很多,就先選個登山預報資料好了,這次選擇json格式。如下圖。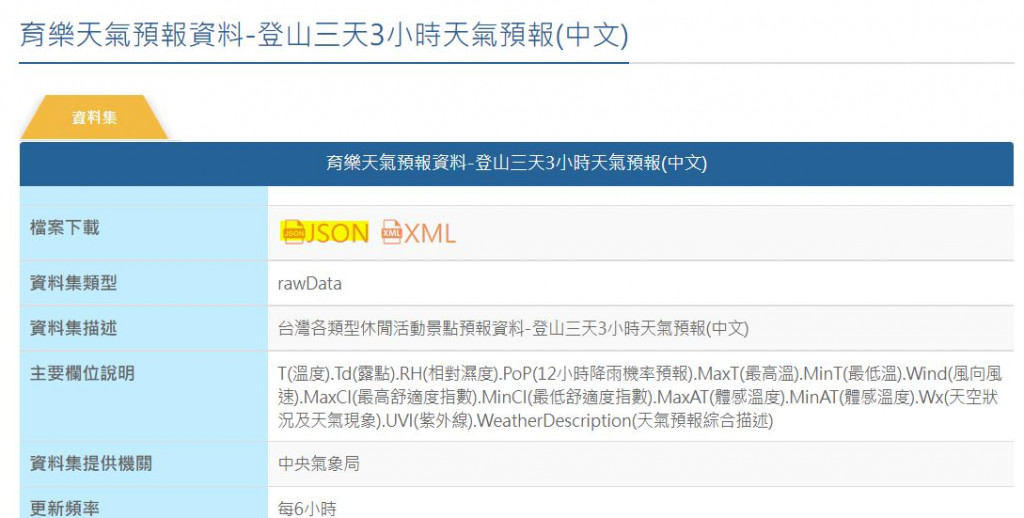
我自己覺得json資料格式是xml跟dict的合體。下載之後的檔名為F-B0053-035.json
利用安裝python之後就會有的json套件來讀取json格式資料
json格式資料如何讀取在網路上已經有很多介紹,在此就不多說了。
import json

with open("F-B0053-035.json","r",encoding='utf-8') as jj:
    fn = json.load(jj)
然後再寫以測站為出發的function,然後刻意寫一個山的名稱對應index及山對應其經緯度的字典
import numpy as np
import pandas as pd
def onestation(stns):
    hdlist = ["fcst time"]
    obs = []
    for hd in range(len(stns["weatherElement"])):
        headname = stns["weatherElement"][hd]['elementName']
        hdlist.append(headname)
        timelist = stns["weatherElement"][hd]["time"]
        if headname == "T":
            fcst_length = len(stns["weatherElement"][hd]["time"])
            fchr = [ stns["weatherElement"][hd]["time"][tau]["dataTime"] for tau in range(fcst_length) ]
            chang = [ fchrstr.split("T")[0][5:7] + fchrstr.split("T")[0][8:10] + fchrstr.split("T")[1][:2] for fchrstr in fchr]
        for tau in range(len(timelist)):
            if headname == "PoP6h":
                for i in range(2):
                    obs.append(timelist[tau]["elementValue"]["value"])
            elif headname == "PoP12h":
                for i in range(4):
                    obs.append(timelist[tau]["elementValue"]["value"])
            elif headname != "WS" and headname != "CI" and headname != "Wx":
                obs.append(timelist[tau]["elementValue"]["value"])
            else:
                obs.append(timelist[tau]["elementValue"][0]["value"])
    npcb = np.concatenate((np.array(chang),np.array(obs)))
    obsdf = pd.DataFrame(npcb.reshape(-1,fcst_length).T,columns = hdlist)
    return obsdf

mountaindict, latdict, londict = {}, {}, {}
cnt = 0
for mouants in fn["cwbopendata"]["dataset"]["locations"]['location']:
    mountaindict.update({mouants["locationName"]:cnt})
    latdict.update({mouants["locationName"]:mouants["lat"]})
    londict.update({mouants["locationName"]:mouants["lon"]})
    cnt +=1
接者就可以依照mountaindict中的山名創建其預報資料表
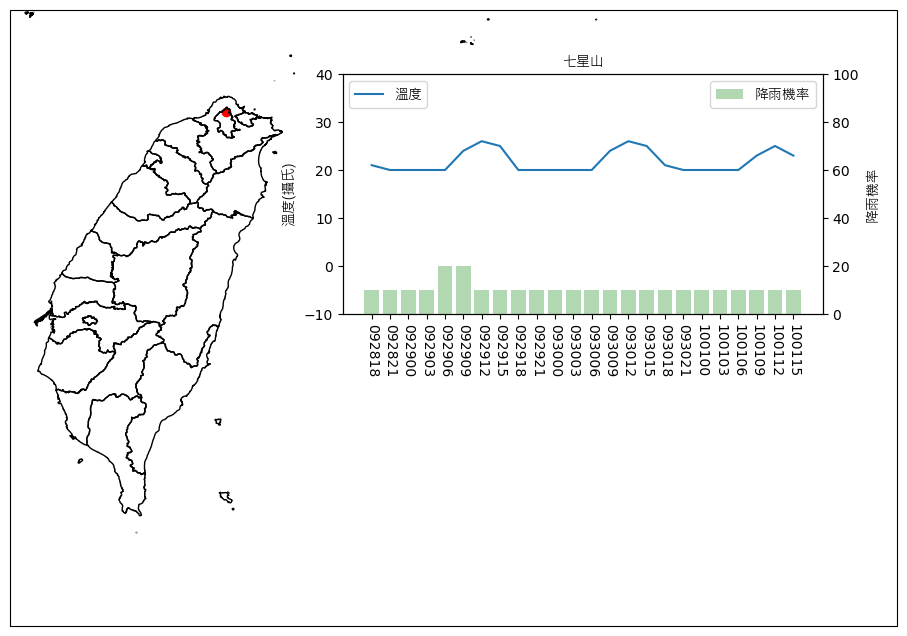
mountain = "七星山"
mountain_idx = mountaindict[mountain]
mlat = float(latdict[mountain])
mlon = float(londict[mountain])
mdf = onestation(fn["cwbopendata"]["dataset"]["locations"]['location'][mountain_idx])
利用得到的資料表(mdf)及經緯度dict視覺化
import matplotlib.pyplot as plt
import cartopy.crs as crs
import cartopy.io.shapereader as shpreader
from cartopy.feature import ShapelyFeature
from pathlib import Path

fpath = Path("font/msjh.ttf")
fig = plt.figure(figsize=(12,8))
axs = plt.axes(projection=crs.PlateCarree())

tw_shp = ShapelyFeature(shpreader.Reader("tw_shp\COUNTY_MOI_1090820.shp").geometries(), \
                        crs.PlateCarree(),facecolor="none",edgecolor='k')
axs.add_feature(tw_shp)
axs.scatter(mlon,mlat,color="r",transform=crs.PlateCarree())

axs.set_extent([119.8,127,21,26])
axes2= fig.add_axes([0.42,0.5,0.4,0.3])
p1 = axes2.plot(mdf["T"].astype(float),label="溫度")
axes2.set_xticks(np.arange(24),mdf["fcst time"],rotation=270)
axes2.set_ylabel("溫度(攝氏)",font=fpath)
axes2.set_ylim(-10,40)
axes2.set_title(mountain,font=fpath)

axes2_r = axes2.twinx()
p2 = axes2_r.bar(range(24),mdf["PoP6h"].astype(float),alpha=0.3,color='g',label="降雨機率")
axes2_r.set_ylim(0,100)
axes2_r.set_ylabel("降雨機率",font=fpath)
axes2.legend(loc='upper left',prop=fpath)
axes2_r.legend(loc='upper right',prop=fpath)
視覺化圖如下,紅色圓點就是山的所在位置,右邊的圖示一些視覺化的氣象要素,這邊選的是溫度與降雨機率。