今天一樣是解預報資料JSON儲存格式。
主要的目標是定量降水預報格點資料,但目前氣象局僅提供「陸上颱風警報期間台灣地區定量降水格點預報」。
所謂的定量降水格點預報,是預報員透過很多客觀數值預報資料統整後的產品。可以看成是集結數值預報智慧的產品。
先下載JSON,下載的檔案為F-C0041-001.json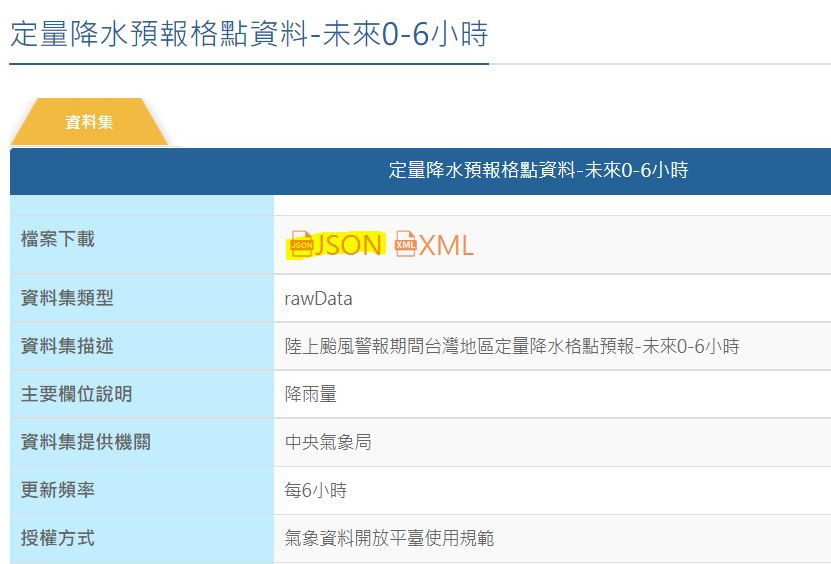
解資料,基本上從第一天到現在,已經很清楚不管是xml或json,第一個檔頭或標記會是cwbopendata
import json
import numpy as np
import pandas as pd
from datetime import datetime, timedelta
with open("F-C0041-001.json","r",encoding='utf-8') as jj:
    fn = json.load(jj)
print(fn["cwbopendata"])
上述會得到以下資訊(擷取部分)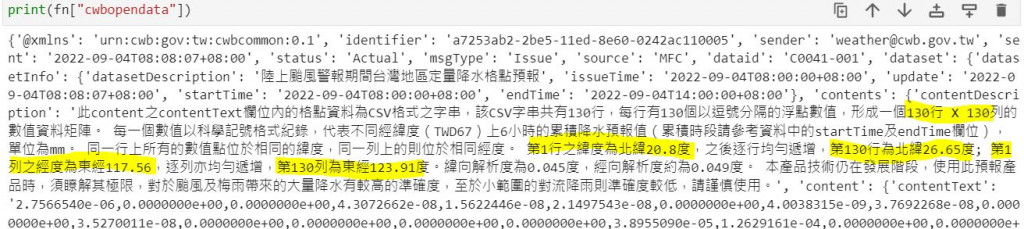
知道經緯度的起始點與終點、累積降雨時間點的開始與結束、格點數。根據這些資訊處理資料。
sttime = datetime.strptime(fn["cwbopendata"]["dataset"]["datasetInfo"]["startTime"],"%Y-%m-%dT%H:%M:%S+08:00")
entime = datetime.strptime(fn["cwbopendata"]["dataset"]["datasetInfo"]["endTime"],"%Y-%m-%dT%H:%M:%S+08:00")
sttimestr = sttime.strftime("%Y-%m-%d %H")
entimestr = entime.strftime("%Y-%m-%d %H")
ygrid , xgrid  = 130, 130
lon,lat = np.meshgrid(np.linspace(117.56,123.91,xgrid),np.linspace(20.8,26.65,ygrid))
rainstr = fn["cwbopendata"]["dataset"]["contents"]["content"]["contentText"].split(",")
rain = np.array(rainstr,dtype=float).reshape(ygrid , xgrid)
maxrainypos,maxrainxpos=np.where(rain == rain.max())  #取得雨量最大值的位置
視覺化如下
import matplotlib.colors as mcolors
import cartopy.crs as crs
import cartopy.io.shapereader as shpreader
from cartopy.feature import ShapelyFeature

colorlevel = [0,1,2,6,10,15,20,30,40,50,70,90,110,130,150,200,300,400]
cwb_data=['None','#9BFFFF','#00CFFF','#0198FF','#0165FF','#309901',\
          '#32FF00','#F8FF00','#FFCB00','#FF9A00','#FA0300','#CC0003',\
          '#A00000','#98009A','#C304CC','#F805F3','#FECBFF']
cmaps = mcolors.ListedColormap(cwb_data,'precipitation')
norms = mcolors.BoundaryNorm(colorlevel, cmaps.N)
fig = plt.figure(figsize=(12,8))
axs = plt.axes(projection=crs.PlateCarree())
shapefile = "tw_shp\COUNTY_MOI_1090820.shp"
tw_shp = ShapelyFeature(shpreader.Reader(shapefile).geometries(), \
                        crs.PlateCarree(),facecolor="none",\
                        edgecolor='k',lw=0.8)
axs.gridlines(draw_labels=True)
axs.add_feature(tw_shp)
axs.text(lon[maxrainypos,maxrainxpos],lat[maxrainypos,maxrainxpos],\
         s="{:.2f}".format(rain[maxrainypos,maxrainxpos][0]),\
         transform=crs.PlateCarree()) #標最大值
ctf = axs.contourf(lon, lat, rain, cmap = cmaps, norm = norms,\
                   levels=colorlevel,transform=crs.PlateCarree())
cb = plt.colorbar(ctf)
cb.set_label("mm")
titlestr = "6hr accumlated rainfall \n from {} to {}".format(sttimestr,entimestr)
plt.title(titlestr,fontsize=16)
視覺化圖形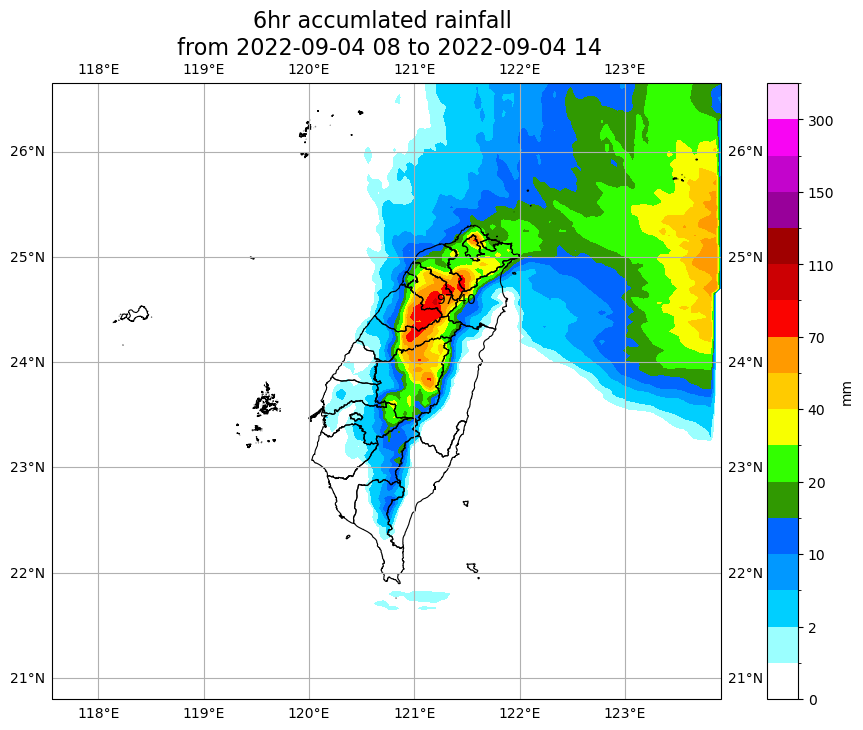
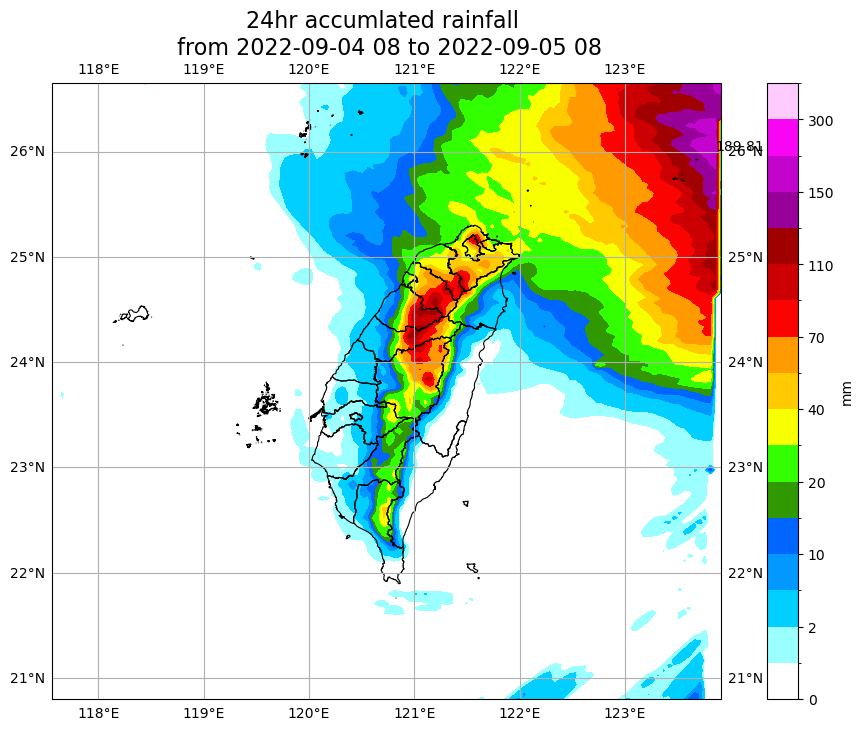
那氣象局有提供0-6, 6-12, 12,18, 18-24四種分段6小時累積定量格點降雨。
若將四個時段加總,就是得到24小時累積定量格點降雨囉