今天繼續說明昨天提到的Rainbow5資料,但介紹另一個比較方便讀取的方法。
一樣使用的是wradlib套件。
方法如下
import wradlib.io.rainbow as irainbow
rvol = irainbow.open_rainbow_dataset("day25/2022052607405300dBZ.vol")
print(rvol)
'''
print(rovl)會得到這一份雷達掃描資料的仰角資訊,如下
<wradlib.RadarVolume>
Dimension(s): (sweep: 20)
Elevation(s): (0.5, 1.4, 2.4, 0.5, 1.4, 2.4, 3.4, 4.3, 0.5, 1.4, 2.4, 6.0, 9.9, 0.5, 1.4, 2.4, 14.6, 19.5, 24.5, 29.9)
這代表有20個仰角,每個仰角的高度可由Elevations得知。
簡單想像的話,這筆資料提供了20個在不同或相同高度360度的水滴分布狀況。
之前有提到氣象雷達掃描是掃描空氣中的水滴。
'''

#取第1個仰角,會回傳xarray物件
firsteledata = rvol[0].copy(wrl.georef.georeference_dataset)
print(firsteledata)
'''
print(firsteledata) 會得到如下訊息
<xarray.Dataset>
Dimensions:     (azimuth: 360, range: 1600)
Coordinates:
  * azimuth     (azimuth) float64 0.5 1.5 2.5 3.5 ... 356.5 357.5 358.5 359.5
  * range       (range) float32 125.0 375.0 625.0 ... 3.996e+05 3.999e+05
    elevation   (azimuth) float64 ...
    time        datetime64[ns] 2022-05-26T07:40:53
    rtime       (azimuth) datetime64[ns] ...
    longitude   float64 ...
    latitude    float64 ...
    altitude    float64 ...
    sweep_mode  <U20 ...
Data variables:
    DBZH        (azimuth, range) float32 ...
Attributes:
    fixed_angle:  0.5

也就是這個讀取資料的方法已經將昨天
自行要處理的資料全數處理好了
'''
視覺化
import matplotlib.pyplot as plt
import cartopy
import cartopy.crs as crs
import cartopy.io.shapereader as shpreader
from cartopy.feature import ShapelyFeature
import numpy as np
import matplotlib.colors as mcolors
from cartopy.mpl.gridliner import LONGITUDE_FORMATTER, LATITUDE_FORMATTER
import matplotlib.ticker as mticker
from datetime import datetime, timedelta
from pathlib import Path
import matplotlib.font_manager as font_manager

fpath = Path("font/msjh.ttf")
msjhfont=font_manager.FontProperties(fname=fpath,size=14)

taiwanshpf = "tw_shp/COUNTY_MOI_1090820.shp"
geoshap = shpreader.Reader(taiwanshpf).geometries()
shp_tw = ShapelyFeature(geoshap,
                        crs.PlateCarree(),
                        facecolor='none',
                        edgecolor='k',
                        alpha = 0.85)
map_proj = crs.PlateCarree()
fig = plt.figure(figsize=(10, 8))
ax = plt.axes(projection=map_proj)
r = firsteledata.range.data #取波束(徑向)掃瞄範圍
azi = firsteledata.azimuth.data #取360度掃描的方位角資訊
rcenterlon = firsteledata.longitude.data #取雷達座落位置之緯度
rcenterlat = firsteledata.latitude.data #取雷達座落位置之緯度
rcenteralt = firsteledata.altitude.data #取雷達座落位置之高度
radarcenter = (rcenterlon,rcenterlat,rcenteralt)
cmap = pyart.graph.cm_colorblind.HomeyerRainbow
pm = wrl.vis.plot_ppi(firsteledata.DBZH.data,r=r,az=azi,ax=ax,cmap=cmap,site=radarcenter,proj=map_proj)
ax.scatter(rcenterlon,rcenterlat,transform=crs.PlateCarree(),c="r",marker="^")
ax.gridlines(draw_labels=True)
ax.add_feature(shp_tw)
plt.colorbar(pm[1],pad=0.1)
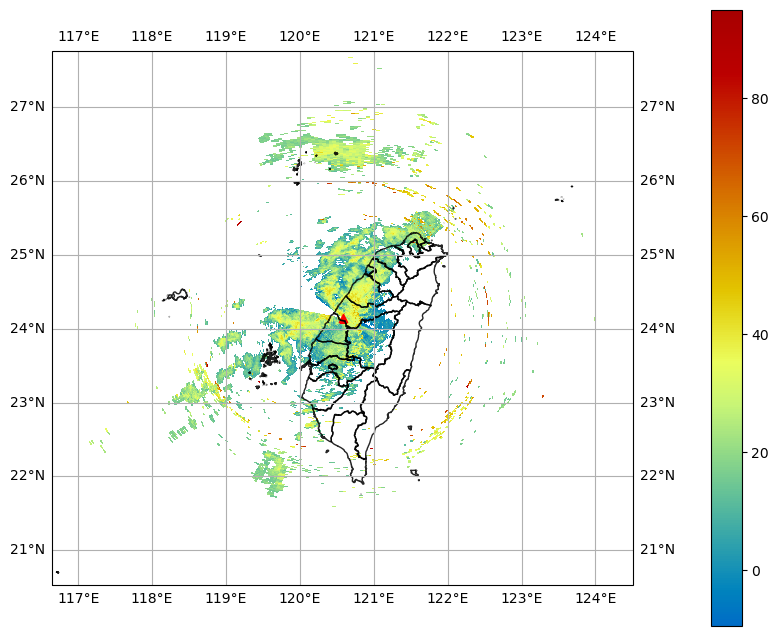
視覺化如下