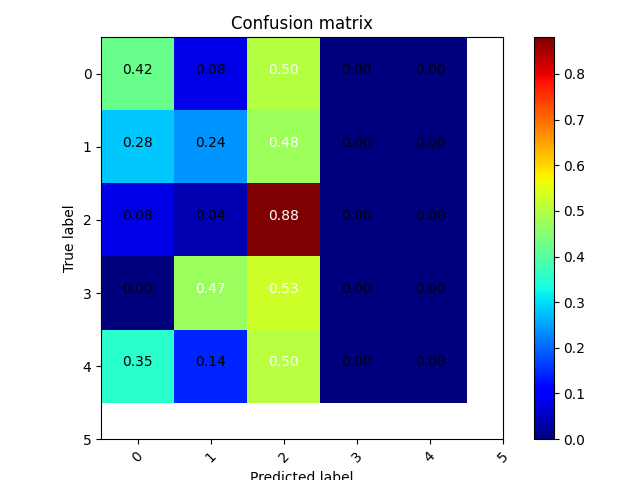
廢廢今天寫好了混淆矩陣的程式碼,先貼上來
附上參考網址keras訓練曲線,混淆矩陣,CNN層輸出可視化_3D_DLW的博客-程序員秘密_keras混淆矩陣
def plot_confusion_matrix(cm,classes,title='Confusion matrix',cmap=plt.cm.jet):
    cm = cm.astype('float') / cm.sum(axis=1)[:,np.newaxis]
    plt.imshow(cm,interpolation='nearest',cmap=cmap)
    plt.title(title)
    plt.colorbar()
    tick_marks = np.arange(len(classes))
    plt.xticks(tick_marks,rotation=45)
    plt.yticks(tick_marks,classes)
    thresh = cm.max() / 2.
    for i,j in product(range(cm.shape[0]),range(cm.shape[1])):
        plt.text(j,i,'{:.2f}'.format(cm[i,j]),horizontalalignment="center",color="white" if cm[i,j] > thresh else "black")

    plt.tight_layout()
    plt.ylabel('True label')
    plt.xlabel('Predicted label')
    plt.savefig('D:/Finish/train/matrix.png')
    plt.show()

# 顯示混淆矩陣
def plot_confuse(model,x_val,y_val):
    predictions = model.predict(x_val).argmax(axis=1) #是找陣列中預測值最大的label
    truelabel = y_val.argmax(axis=-1).astype('float32') # 將one-hot轉化為label,再轉成float
    conf_mat = confusion_matrix(y_true=truelabel,y_pred=predictions) #predictions, truelabel要一樣的type,要不然會錯
    plot_confusion_matrix(conf_mat,range(np.max(truelabel.astype(int))+1)) #truelabel要轉回int

print(val_data.shape)	# (87352, 13, 13, 1)
print(val_label_onehot.shape)	# (87352, 10)
plot_confuse(model, val_data, val_label_onehot)
完成一項任務了,但有些小問題正在排除,混淆矩陣的圖有點怪正在修改中,放一下圖片。
還有將strength和chip輸入矩陣的0~12等級改為將對應位置輸入1也完成。
準確率的部分也從58%提升至59%,令人開心的小成果現在朝向60%以上邁進吧
