使用profile模式,(在windows上的模擬器要x86_64,不然會無法支援)
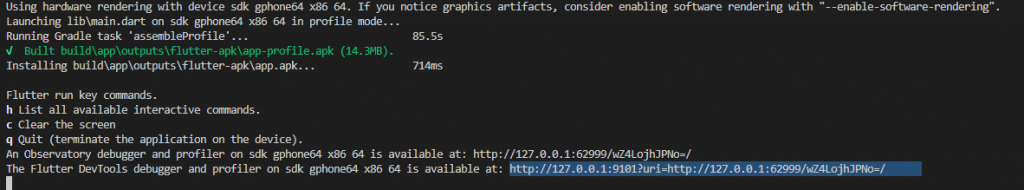
輸入並連接到devtools上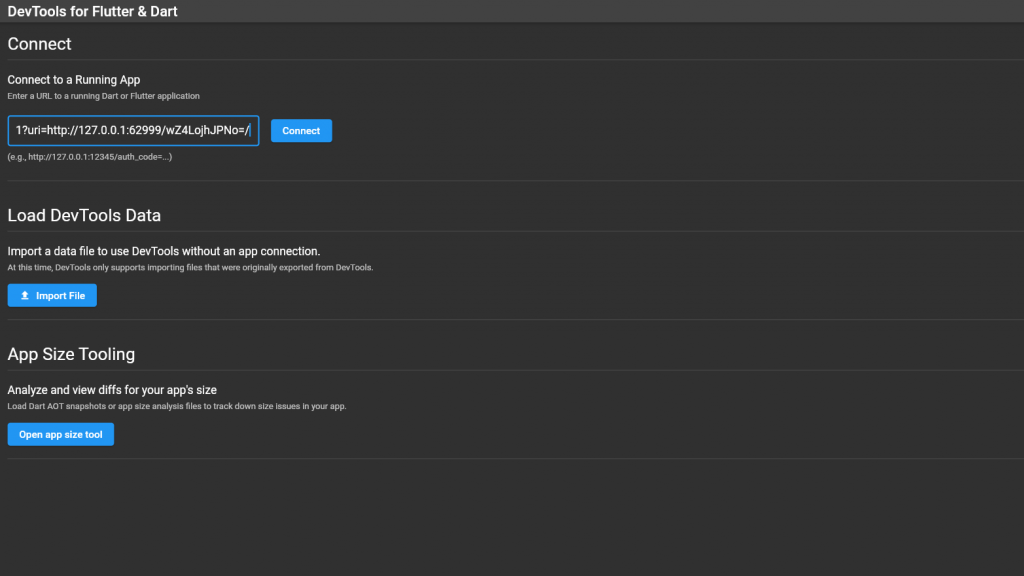
清除並且觀察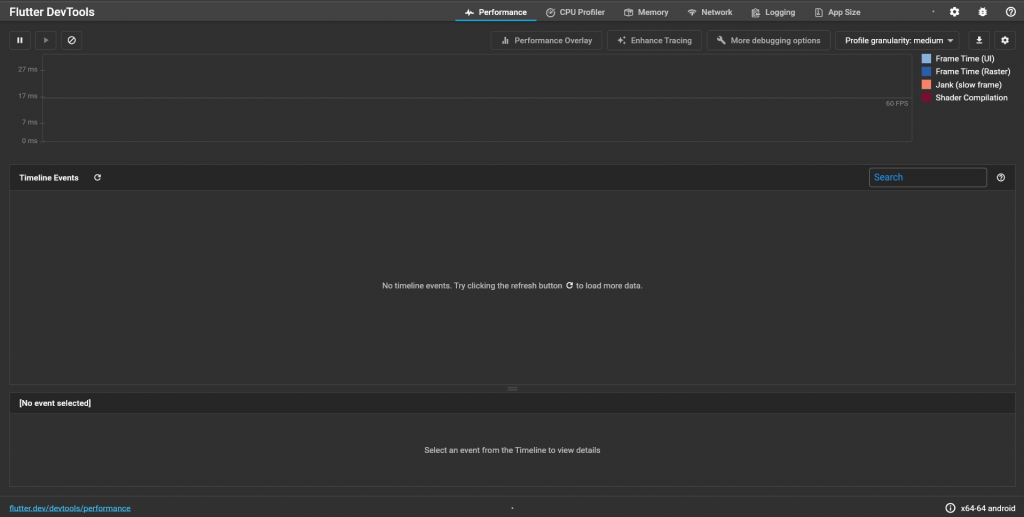
點擊add todo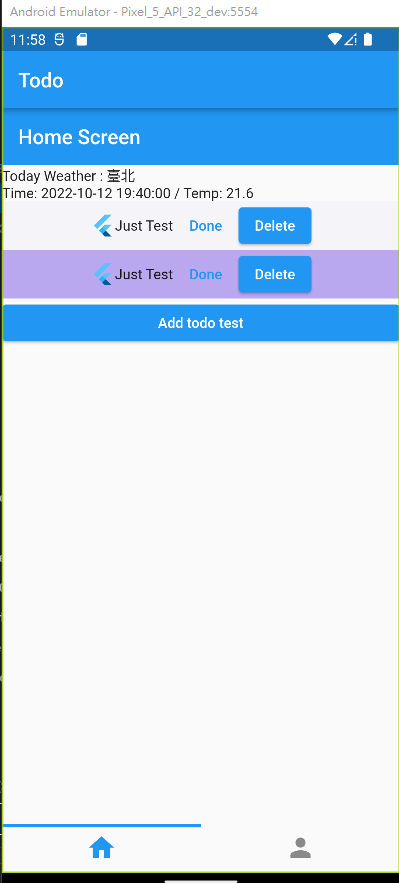
觀察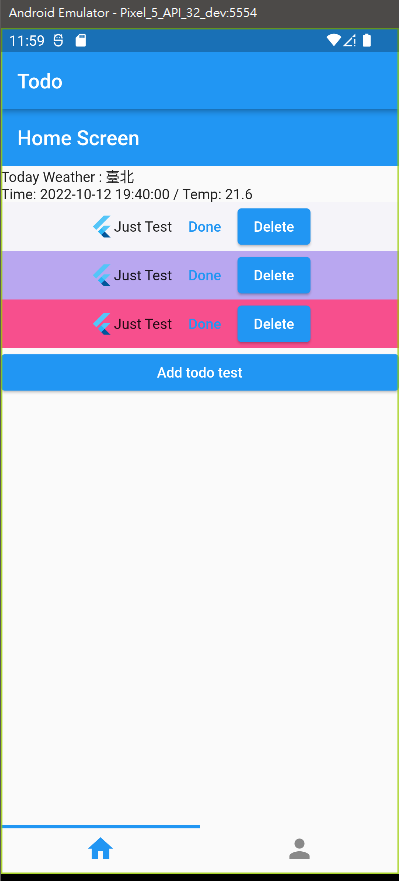
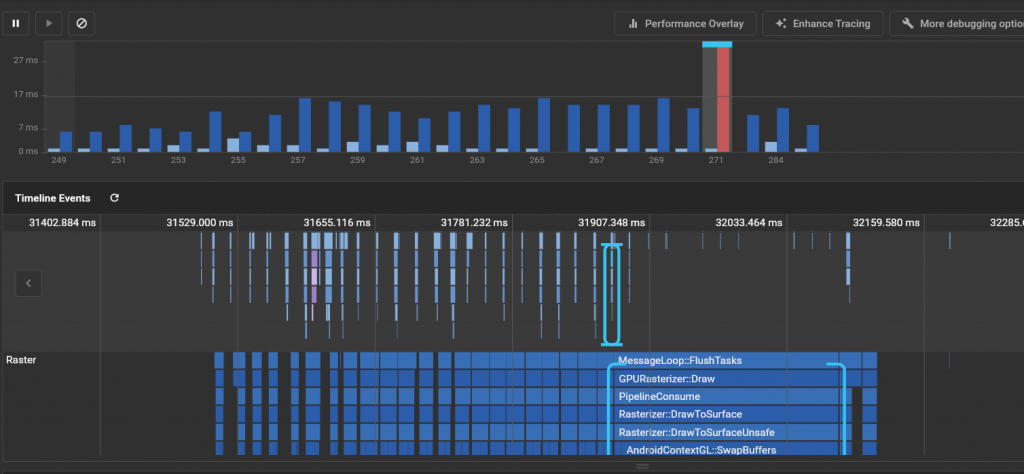
打開能在我們app上看到顯示兩張圖標顯示性能信息一個是UI一個是Raster (GPU)

上面的圖表是Raster(GPU)下面是UI(CPU),第一條橫軸黑線表示16ms(低於就代表有60fps)。綠線則是當前的frame。並且當前frame的豎條,顏色為綠色表示性能良好,為紅色則表示出現了卡頓。
CPU Profile能夠測量並記錄你的 Dart 或 Flutter 應用的片段(並且在profile模式下測量性能)
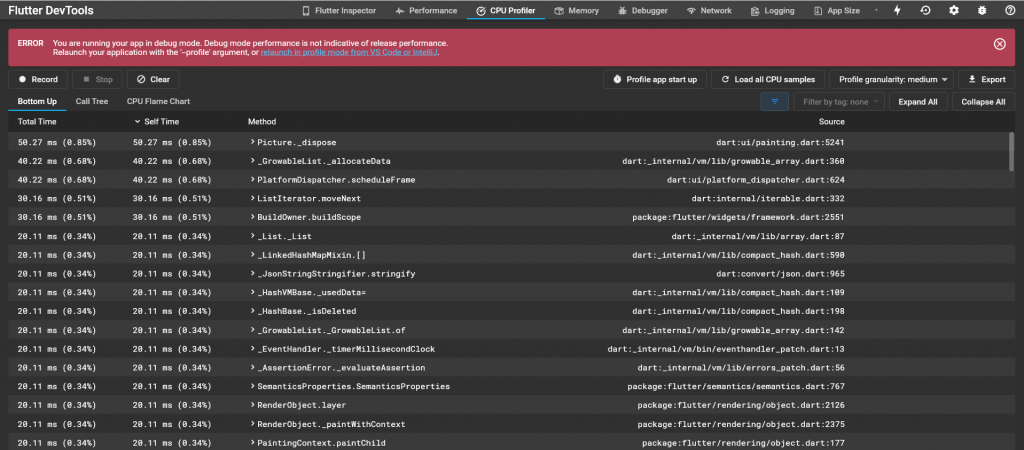
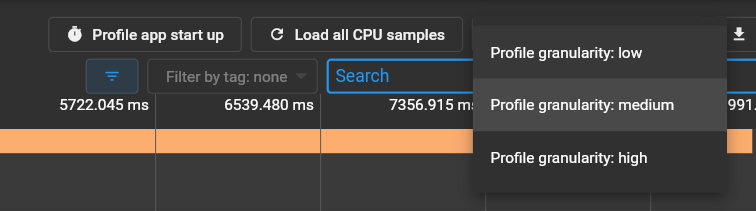
高粒度的配置會具有更高效的採樣率。並且在單位時間內採集的CPU信息會更加詳細且採集樣例更多。並且有可能會影響你的應用程序的運行或導致性能下降
低粒度的配置具有較低的採樣率,單位時間內採集的CPU信息會比較粗略且採集樣例較少。並且這樣也會對你的應用程序性能影響更小。VM的緩衝區填充速度也會較慢,因此可以採集到相當長一段時間內應用程序的CPU信息數據
VM 收集 CPU 樣本的默認速率為 1/250μs (即每 250 微秒收集一次數據)。一般情況下,Profile granularity 的默認值為 “medium”
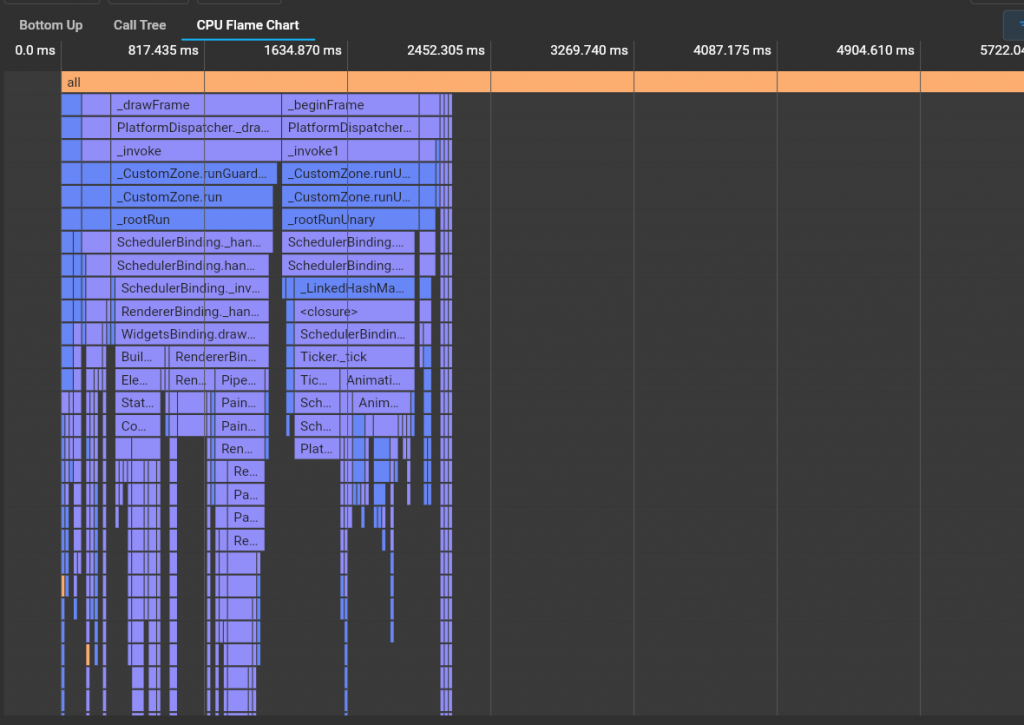
火焰圖主要用於顯示一段持續時間內 CPU 的樣本信息。圖表展示的是自上而下的調用stack信息,即上面的stack frame調用下面的stack frame
一種自上而下展示CPU中的調用Stack信息方法。在下圖中的表格中可以看出,展開其中的一個方法可以查看它所有的調用者
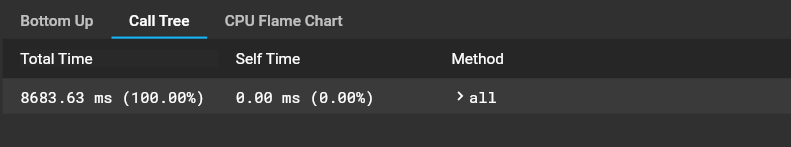
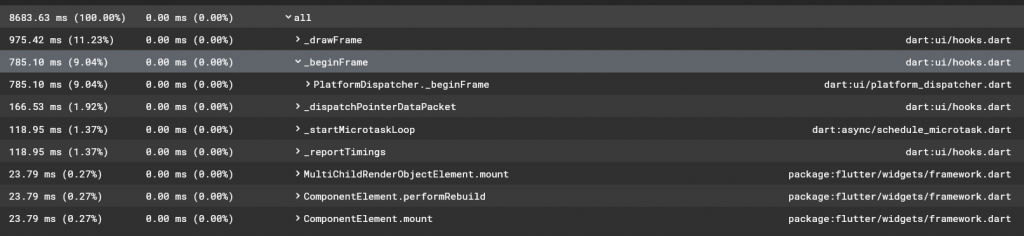
Total Time: 此方法運行的總時間。(即調用此方法整個的生命週期時長)。
Self Time: 僅表示執行當前方法把花費的時長
Method: 調用的方法名稱
Source: 方法所在的文件路徑
一個自下而上的表示方式。表格中的每個最上方的方法實際上是給定CPU樣本的調用Stack中的最後一個方法 (也就是樣本的leaf node)
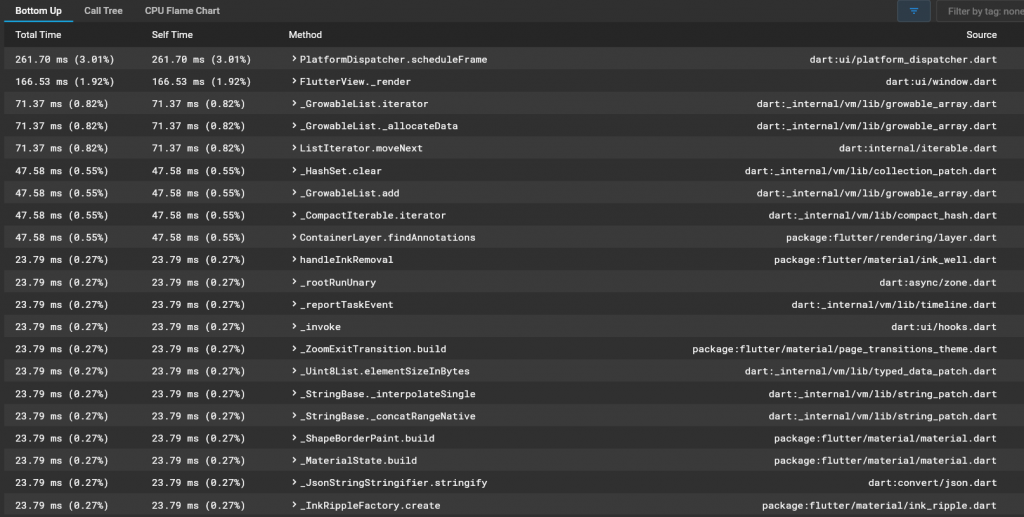
Self Time: 在自下而上調用樹中對於最頂層的方法(leaf stack frame),它表示執行自己的代碼所需要的時間。對於子節點(調用者),它表示調用者運行被調用者的時間
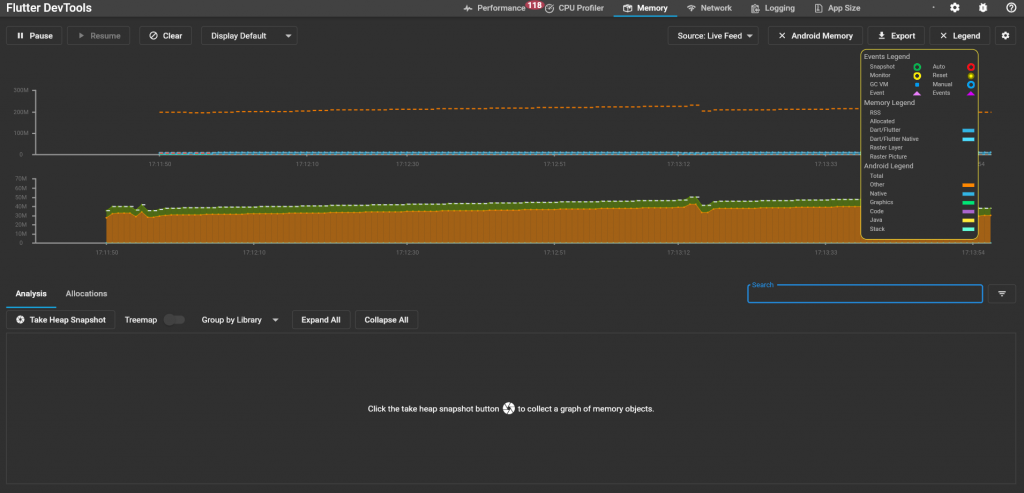
使用類構造函數創建的Dart對象會被分配在heap的內存區域中。heap中的內存由Dart VM管理
ref
Using the CPU profiler view
Using the Memory view
使用内存视图


 iThome鐵人賽