在看完CNN的概念過後,我們利用TensorFlow做一個簡單的CNN實作。首先介紹另一個有名的資料集—CIFAR-10,CIFAR-10中包含60000張32x32的彩色圖片,平均分為10個類別(airplane, automobile, bird, cat, deer, dog, frog, horse, ship, truck),50000張的訓練集以及10000張的測試集。
一開始我們從TensorFlow中引入CIFAR-10資料集,由於我們希望像素的數值介於0~1之間,因此我們將train_images以及test_images除以255.0,讓原先介於0~256間的像素值可以壓縮到0~1之間。
import tensorflow as tf
from tensorflow.keras import datasets, layers, models
import matplotlib.pyplot as plt

(train_images, train_labels), (test_images, test_labels) = datasets.cifar10.load_data()
train_images, test_images = train_images / 255.0, test_images / 255.0
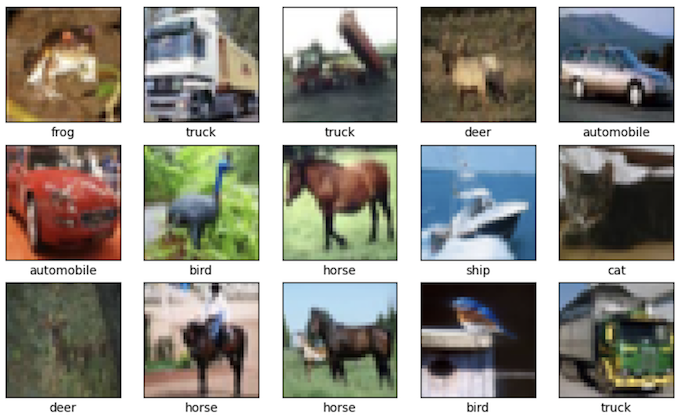
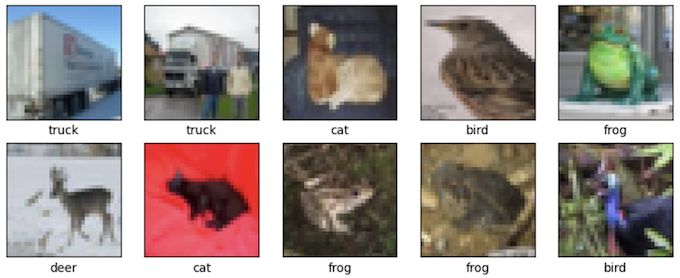
接著我們簡單的利用python的matplotlib.pyplot檢視一下資料集中的內容,可以看到雖然圖像並不是很清楚,但是還是可以大略辨別出分類的。
class_names = ["airplane", "automobile", "bird", "cat", "deer", "dog", "frog", "horse", "ship", "truck"]

plt.figure(figsize = (10, 10))
for i in range(25):
    plt.subplot(5, 5, i + 1)
    plt.xticks([])
    plt.yticks([])
    plt.imshow(train_images[i])
    plt.xlabel(class_names[train_labels[i][0]])

plt.show()
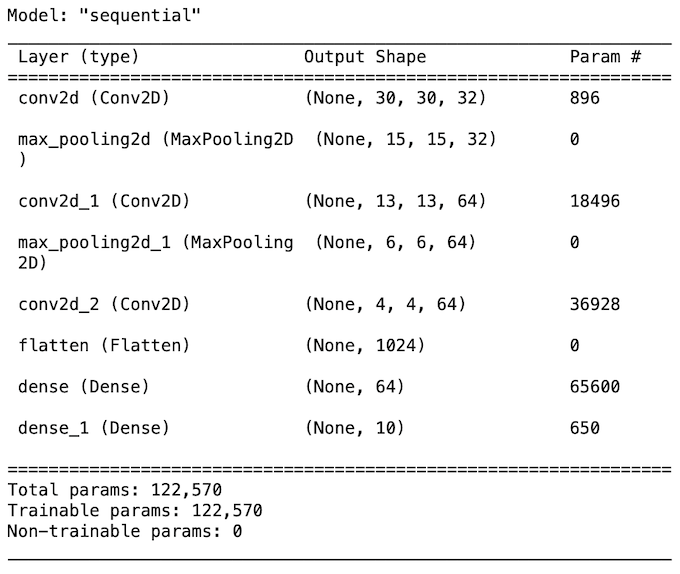
接著就要來建立CNN了,我們利用前一天講過的卷積層(Convolution Layer)和最大化池化層(Max Pooling Layer)去做模型的建構。
model = models.Sequential()
model.add(layers.Conv2D(32, (3, 3), activation = "relu", input_shape = (32, 32, 3)))
model.add(layers.MaxPooling2D((2, 2)))
model.add(layers.Conv2D(64, (3, 3), activation = "relu"))
model.add(layers.MaxPooling2D((2, 2)))
model.add(layers.Conv2D(64, (3, 3), activation = "relu"))

model.add(layers.Flatten())
model.add(layers.Dense(64, activation = "relu"))
model.add(layers.Dense(10))

model.summary()
建立完模型過後,我們直接將訓練資料給丟進去做訓練,並且指定test_images為驗證。
model.compile(optimizer = "adam",
              loss = tf.keras.losses.SparseCategoricalCrossentropy(from_logits = True),
              metrics = ["accuracy"])

history = model.fit(train_images, train_labels, epochs = 10,
                    validation_data = (test_images, test_labels))
訓練完過後,再次利用python的matplotlib.pyplot繪製隨著訓練的epoch提升,準確度如何變化的2D圖。可以看見驗證資料的準確度最終落在7成左右。
model.compile(optimizer = "adam",
              loss = tf.keras.losses.SparseCategoricalCrossentropy(from_logits = True),
              metrics = ["accuracy"])

history = model.fit(train_images, train_labels, epochs = 10,
                    validation_data = (test_images, test_labels))
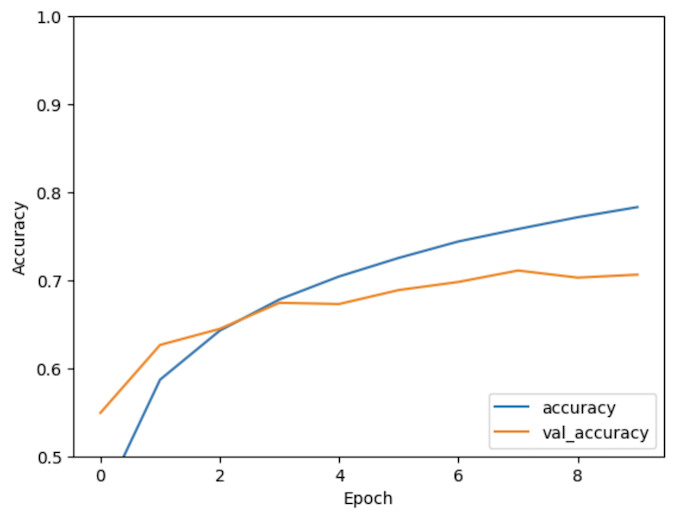
實際印出測試準確度為0.7063000202178955,的確大約為7成。那今天一個簡單的利用TensorFlow訓練一個CNN模型就完成啦!
print(test_acc)
參考資料:https://www.tensorflow.org/tutorials/images/cnn
訓練完過後,再次利用python的matplotlib.pyplot繪製隨著訓練的epoch提升,準確度如何變化的2D圖。可以看見驗證資料的準確度最終落在7成左右。
這邊的程式碼重複,應為:
plt.plot(history.history['accuracy'], label='accuracy')
plt.plot(history.history['val_accuracy'], label = 'val_accuracy')
plt.xlabel('Epoch')
plt.ylabel('Accuracy')
plt.ylim([0.5, 1])
plt.legend(loc='lower right')
test_loss, test_acc = model.evaluate(test_images, test_labels, verbose=2)