Hello 大家好!歡迎回來!昨天剛剛分享完資料視覺化 (Data Visualization)的頭 30 個 Python 可視化圖表,那今天我打算跟大家分享資料視覺化 (Data Visualization)的 最後 10 個 Python 可視化圖表以及其應用領域。事不宜遲,現在開始!
美國大選投票經常看見的地圖。
import pandas as pd
import geopandas as gpd
import matplotlib.pyplot as plt

# 讀取數據
file = "us_states_hexgrid.geojson.json"
geoData = gpd.read_file(file)
geoData['centroid'] = geoData['geometry'].apply(lambda x: x.centroid)

mariageData = pd.read_csv("State_mariage_rate.csv")
geoData['state'] = geoData['google_name'].str.replace(' \(United States\)','')

geoData = geoData.set_index('state').join(mariageData.set_index('state'))


# 初始化
fig, ax = plt.subplots(1, figsize=(6, 4))

# 繪圖
geoData.plot(
    ax=ax,
    column="y_2015",
    cmap="BuPu",
    norm=plt.Normalize(vmin=2, vmax=13),
    edgecolor='black',
    linewidth=.5
);

# 不顯示座標軸
ax.axis('off')

# 標題, 副標題,作者
ax.annotate('Mariage rate in the US', xy=(10, 340),  xycoords='axes pixels', horizontalalignment='left', verticalalignment='top', fontsize=14, color='black')
ax.annotate('Yes, people love to get married in Vegas', xy=(10, 320),  xycoords='axes pixels', horizontalalignment='left', verticalalignment='top', fontsize=11, color='#808080')
ax.annotate('xiao F', xy=(400, 0),  xycoords='axes pixels', horizontalalignment='left', verticalalignment='top', fontsize=8, color='#808080')

# 每個網格
for idx, row in geoData.iterrows():
    ax.annotate(
        s=row['iso3166_2'],
        xy=row['centroid'].coords[0],
        horizontalalignment='center',
        va='center',
        color="white"
    )

# 添加顏色
sm = plt.cm.ScalarMappable(cmap='BuPu', norm=plt.Normalize(vmin=2, vmax=13))
fig.colorbar(sm, orientation="horizontal", aspect=50, fraction=0.005, pad=0 );

# 顯示
plt.show()
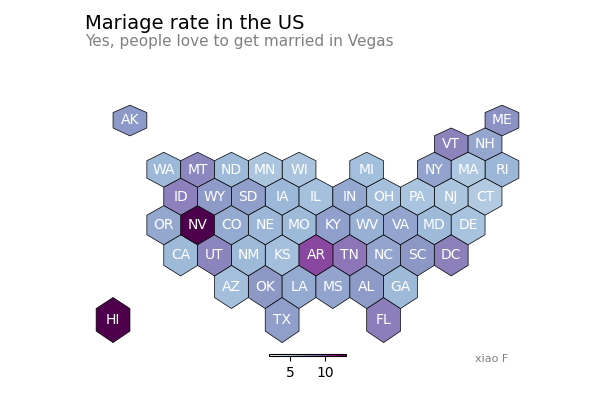
變形地圖是形狀發生改變的地圖,其中每個區域的形狀,會根據數值發生扭曲變化。
這裏沒有 python 代碼 D:
連接映射地圖可以顯示地圖上幾個位置之間的連接關係。這比較像是航空上經常用到的飛線圖的升級版。
from mpl_toolkits.basemap import Basemap
import matplotlib.pyplot as plt
import pandas as pd

# 數據
cities = {
    'city': ["Paris", "Melbourne", "Saint.Petersburg", "Abidjan", "Montreal", "Nairobi", "Salvador"],
    'lon': [2, 145, 30.32, -4.03, -73.57, 36.82, -38.5],
    'lat': [49, -38, 59.93, 5.33, 45.52, -1.29, -12.97]
}
df = pd.DataFrame(cities, columns=['city', 'lon', 'lat'])

# 創建地圖
m = Basemap(llcrnrlon=-179, llcrnrlat=-60, urcrnrlon=179, urcrnrlat=70, projection='merc')
m.drawmapboundary(fill_color='white', linewidth=0)
m.fillcontinents(color='#f2f2f2', alpha=0.7)
m.drawcoastlines(linewidth=0.1, color="white")

# 循環建立連接
for startIndex, startRow in df.iterrows():
    for endIndex in range(startIndex, len(df.index)):
        endRow = df.iloc[endIndex]
        m.drawgreatcircle(startRow.lon, startRow.lat, endRow.lon, endRow.lat, linewidth=1, color='#69b3a2');

# 添加城市名稱
for i, row in df.iterrows():
    plt.annotate(row.city, xy=m(row.lon + 3, row.lat), verticalalignment='center')

plt.show()

氣泡地圖使用不同尺寸的圓來表示該地理座標的數值。
import folium
import pandas as pd

# 創建地圖對象
m = folium.Map(location=[20,0], tiles="OpenStreetMap", zoom_start=2)

# 座標點數據
data = pd.DataFrame({
   'lon': [-58, 2, 145, 30.32, -4.03, -73.57, 36.82, -38.5],
   'lat': [-34, 49, -38, 59.93, 5.33, 45.52, -1.29, -12.97],
   'name': ['Buenos Aires', 'Paris', 'melbourne', 'St Petersbourg', 'Abidjan', 'Montreal', 'Nairobi', 'Salvador'],
   'value': [10, 12, 40, 70, 23, 43, 100, 43]
}, dtype=str)

# 添加氣泡
for i in range(0, len(data)):
    folium.Circle(
      location=[data.iloc[i]['lat'], data.iloc[i]['lon']],
      popup=data.iloc[i]['name'],
      radius=float(data.iloc[i]['value'])*20000,
      color='crimson',
      fill=True,
      fill_color='crimson'
    ).add_to(m)

# 保存
m.save('bubble-map.html')
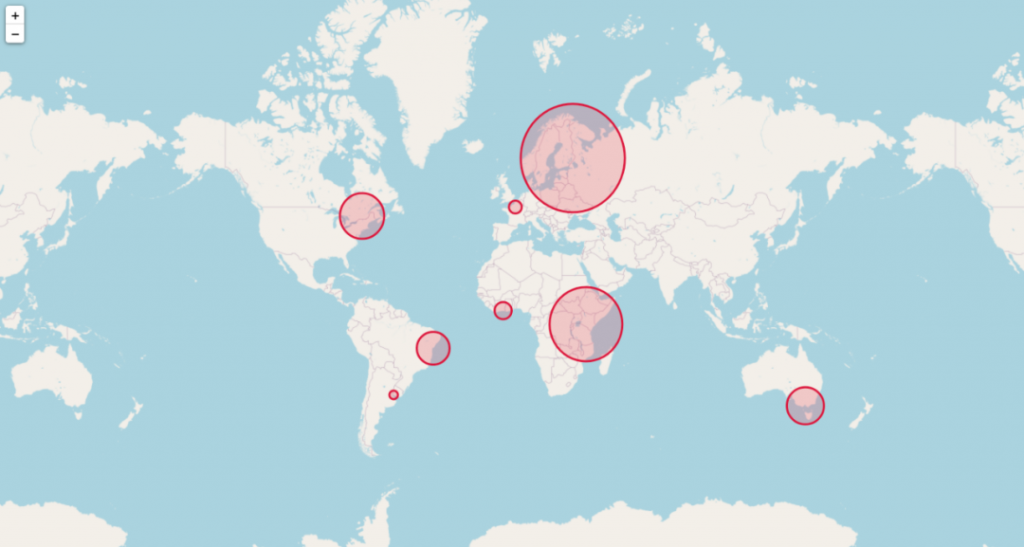
和絃圖表示若干個實體 (節點) 之間的流或連接。每個實體 (節點) 有圓形佈局外部的一個片段表示,然後在每個實體之間繪製弧線,弧線的大小與流的關係成正比。(對我來説看起來莫名其妙)
from chord import Chord

matrix = [
    [0, 5, 6, 4, 7, 4],
    [5, 0, 5, 4, 6, 5],
    [6, 5, 0, 4, 5, 5],
    [4, 4, 4, 0, 5, 5],
    [7, 6, 5, 5, 0, 4],
    [4, 5, 5, 5, 4, 0],
]

names = ["Action", "Adventure", "Comedy", "Drama", "Fantasy", "Thriller"]

# 保存
Chord(matrix, names).to_html("chord-diagram.html")

網狀圖顯示的是一組實體之間的連接關係。每個實體由一個節點表示,節點之間通過線段連接。(這比剛才的更莫名其妙)
import pandas as pd
import numpy as np
import networkx as nx
import matplotlib.pyplot as plt

# 創建數據
ind1 = [5, 10, 3, 4, 8, 10, 12, 1, 9, 4]
ind5 = [1, 1, 13, 4, 18, 5, 2, 11, 3, 8]
df = pd.DataFrame(
    {'A': ind1, 'B': ind1 + np.random.randint(10, size=(10)), 'C': ind1 + np.random.randint(10, size=(10)),
     'D': ind1 + np.random.randint(5, size=(10)), 'E': ind1 + np.random.randint(5, size=(10)), 'F': ind5,
     'G': ind5 + np.random.randint(5, size=(10)), 'H': ind5 + np.random.randint(5, size=(10)),
     'I': ind5 + np.random.randint(5, size=(10)), 'J': ind5 + np.random.randint(5, size=(10))})

# 計算相關性
corr = df.corr()

# 轉換
links = corr.stack().reset_index()
links.columns = ['var1', 'var2', 'value']

# 保持相關性超過一個閾值, 刪除自相關性
links_filtered = links.loc[(links['value'] > 0.8) & (links['var1'] != links['var2'])]

# 生成圖
G = nx.from_pandas_edgelist(links_filtered, 'var1', 'var2')

# 繪製網絡
nx.draw(G, with_labels=True, node_color='orange', node_size=400, edge_color='black', linewidths=1, font_size=15)

# 顯示
plt.show()
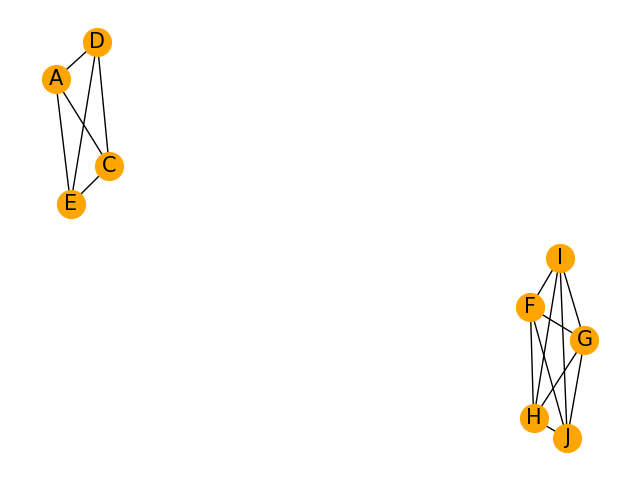
桑基圖主要用來表示原材料、能量等如何從初始形式經過中間過程的加工、轉化到達最終形式。
import plotly.graph_objects as go
import json

# 讀取數據
with open('sankey_energy.json') as f:
    data = json.load(f)

# 透明度
opacity = 0.4
# 顏色
data['data'][0]['node']['color'] = ['rgba(255,0,255, 0.8)' if color == "magenta" else color for color in data['data'][0]['node']['color']]
data['data'][0]['link']['color'] = [data['data'][0]['node']['color'][src].replace("0.8", str(opacity))
                                    for src in data['data'][0]['link']['source']]

fig = go.Figure(data=[go.Sankey(
    valueformat=".0f",
    valuesuffix="TWh",
    # 點
    node=dict(
      pad=15,
      thickness=15,
      line=dict(color = "black", width = 0.5),
      label=data['data'][0]['node']['label'],
      color=data['data'][0]['node']['color']
    ),
    # 線
    link=dict(
      source=data['data'][0]['link']['source'],
      target=data['data'][0]['link']['target'],
      value=data['data'][0]['link']['value'],
      label=data['data'][0]['link']['label'],
      color=data['data'][0]['link']['color']
))])

fig.update_layout(title_text="Energy forecast for 2050<br>Source: Department of Energy & Climate Change, Tom Counsell via <a href='https://bost.ocks.org/mike/sankey/'>Mike Bostock</a>",
                  font_size=10)

# 保持
fig.write_html("sankey-diagram.html")
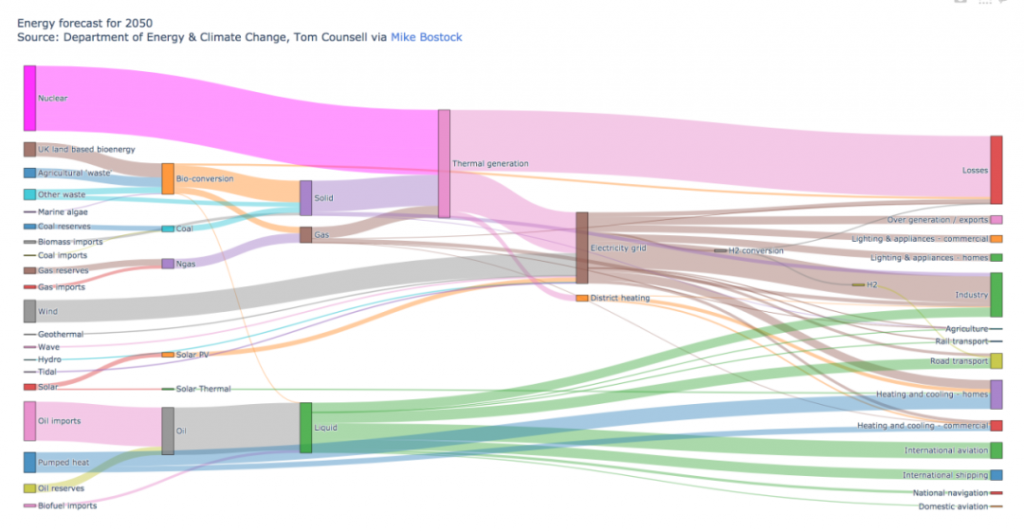
弧線圖由代表實體的節點和顯示實體之間關係的弧線組成的。
目前我還不知道如何用 python 弄,不過應該可以用 R。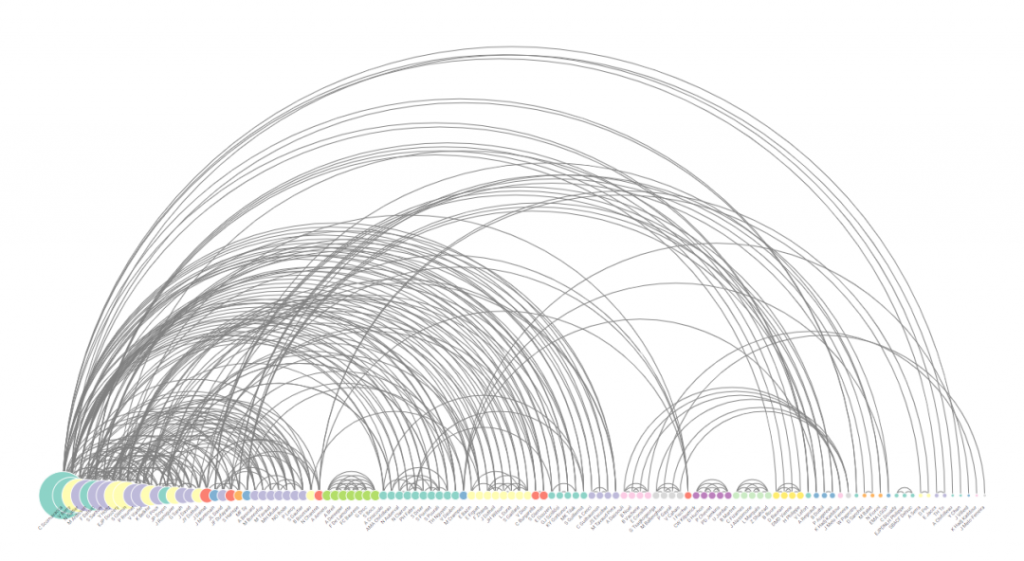
跟弧綫圖差不多,只不過弧綫圖是半圓,環形佈局關係圖是圓形。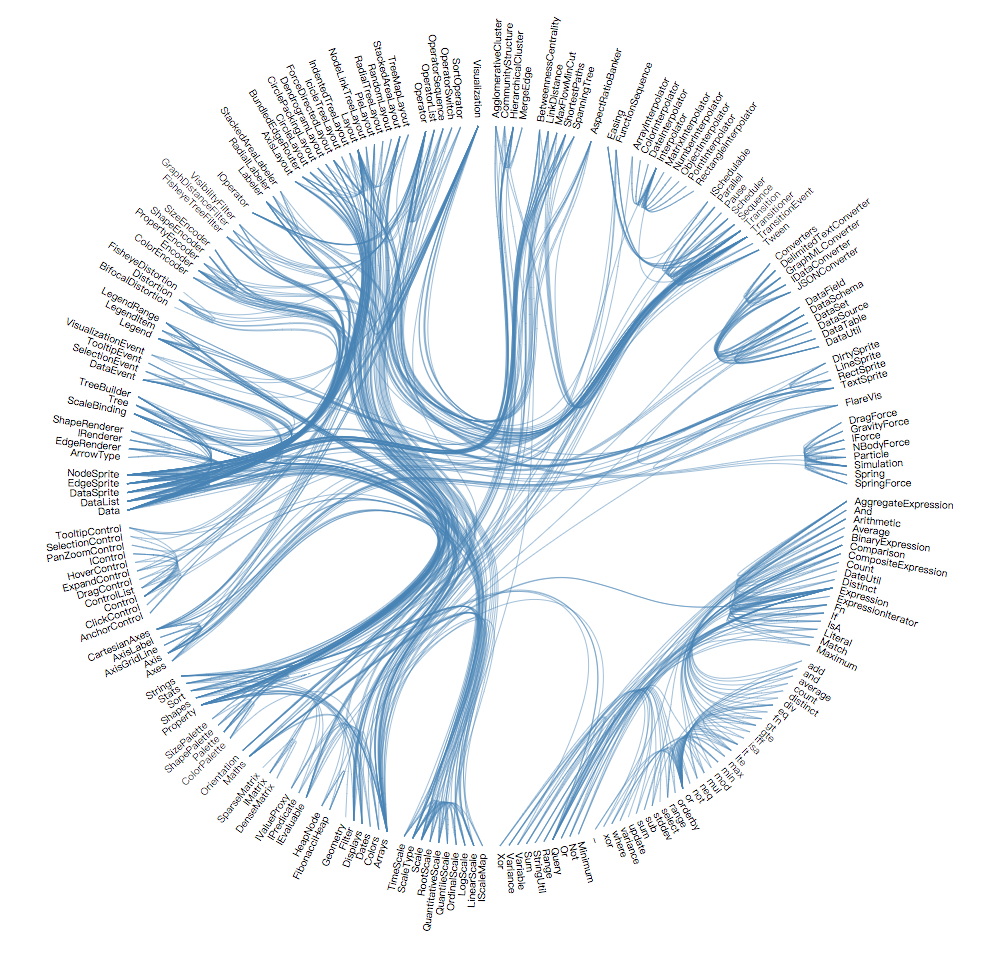
動態圖表本質上就是顯示一系列靜態圖表。
import imageio
import pandas as pd
import matplotlib.pyplot as plt

# 讀取數據
data = pd.read_csv('gapminderData.csv')
# 更改格式
data['continent'] = pd.Categorical(data['continent'])

# 分辨率
dpi = 96

filenames = []
# 每年的數據
for i in data.year.unique():
    # 關閉交互式繪圖
    plt.ioff()

    # 初始化
    fig = plt.figure(figsize=(680 / dpi, 480 / dpi), dpi=dpi)

    # 篩選數據
    subsetData = data[data.year == i]

    # 生成散點氣泡圖
    plt.scatter(
        x=subsetData['lifeExp'],
        y=subsetData['gdpPercap'],
        s=subsetData['pop'] / 200000,
        c=subsetData['continent'].cat.codes,
        cmap="Accent", alpha=0.6, edgecolors="white", linewidth=2)

    # 添加相關信息
    plt.yscale('log')
    plt.xlabel("Life Expectancy")
    plt.ylabel("GDP per Capita")
    plt.title("Year: " + str(i))
    plt.ylim(0, 100000)
    plt.xlim(30, 90)

    # 保存
    filename = './images/' + str(i) + '.png'
    filenames.append(filename)
    plt.savefig(fname=filename, dpi=96)
    plt.gca()
    plt.close(fig)


# 生成GIF動態圖表
with imageio.get_writer('result.gif', mode='I', fps=5) as writer:
    for filename in filenames:
        image = imageio.imread(filename)
        writer.append_data(image)
我發不出 gif 圖,只好用這種方法了:
GIF動態圖表
終於介紹完那些圖表了 :D,現在就讓我説説資料視覺化的應用吧!
 [1]
[1]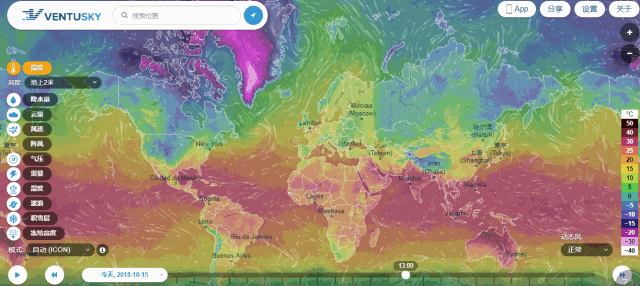 [2]
[2]我是 Mr. cobble,明天見!
