在 Python 中,Pandas 是個常被拿來做資料處理和資料分析的函式庫,在機器學習終能幫助我們做資料的預處理,今天我們就要來用 Pandas 做簡單的資料清洗,包含對資料的查詢、檢查缺值與套件的使用等。
Series 是 Pandas 中的一維資料結構,其類似於 Python 的串列 ( list ) 但有別於串列,Series 物件在初始化時能夠指定傳入資料,它會幫傳入資料的每個元素都從 0 開始,按照順序標上對映的索引 ( Index ),索引的順序和值都可自行設定,如下:
import pandas as pd

# 初始化 Series 物件並設定 Index 依序為 a, b, c
s2 = pd.Series([1, 2, 3], index=['a', 'b', 'c'])
print(s2) # 用tolist()方法可以將Series物件轉為List
Output :
a    1
b    2
c    3
dtype: int64
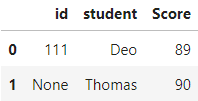
DataFrame 物件常被拿來當作表格資料來使用,每個資料都由行和列組成,它會幫我們創建一個二維的資料表,是個由多個一維的列所組成的二維資料結構,可以搭配字典自己創建資料:
df = pd.DataFrame({"id": ["111", None, "333"],
                   "student": ["Deo", "Thomas", "Leo"],
                   "Score": [89, 90, 90]}
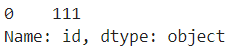
這邊用到 iterrows() 方法能夠將 DataFrame 變為迭代物件 ( iterable object )
for i, j in df.iterrows():
    print(i)
    print(j)
Output :
0
id 111
student Deo
Score 89
Name: 0, dtype: object
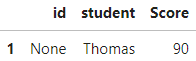
1
id None
student Thomas
Score 90
Name: 1, dtype: object
2
id 333
student Leo
Score 90
Name: 2, dtype: object
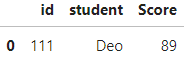
會發現到其實 DataFrame 是由多個一維的 Series 物件 ( 列 ) 所組成的二維資料結構,其每列的資料型態就是 Series,而Series 資料的索引就為對應欄位的名稱。
下面為讀取一個外部 csv 檔的範例,Pandas 還能夠其他類型的檔案,像是 Excel 或 Html 等:
import pandas as pd

# 讀取檔案
data = pd.read_csv('csv檔名')
# data = pd.read_excel('excel檔名')
# data = pd.read_html('html檔名')
Skearn 這個函式庫在機器學習中非常常用,它包括了許多不同的資料集、分類器和訓練模型會用到的諸多套件,為我們省下許多寫演算法的時間,因為大部分它都幫我們寫好並封裝起來了,我們需做的就只有匯入使用,下面為使用 Sklearn 函式庫中的鳶尾花資料集並匯入:
from sklearn.datasets import load_iris
np.set_printoptions(suppress=True)
iris = load_iris()
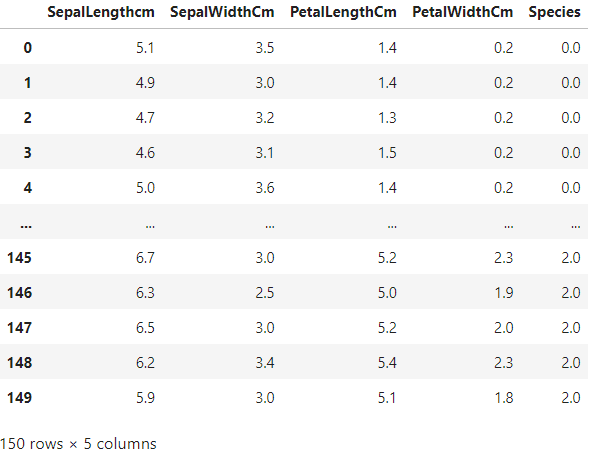
# 建立 DataFrame 物件 df_data,分成五個欄位(sepal花萼 petal花瓣)
df_data = pd.DataFrame(data=np.c_[iris["data"], iris["target"]],
columns=["SepalLengthcm", "SepalWidthCm", "PetalLengthCm", "PetalWidthCm", "Species"])
from sklearn.datasets import load_iris :匯入鳶尾花資料集
np.set_printoptions(suppress=True) :抑制陣列元素的小數點位數
iris = load_iris() : iris 變數為鳶尾花資料集,為字典形式有兩個鍵 data 和 target
這邊用 np.c_ 對把 data 的值和 target 的值沿著欄位的方向 ( 水平 ) 合併起來,下面為合併後資料長的樣子,會發現共有 5 個欄位且有 150 筆資料:
接下來我們來檢查資料中有沒有存在缺漏值,收先建立數據:
data = pd.DataFrame([[70, np.nan, 'Alex'],
										 [45, 160, 'Leo'],
									   [54, 170, 'Rax']],
columns=['Weight', 'Height', 'Name'])
得到資料 data,發現第一筆資料含有缺漏值 ( NaN ):

因此我們面對缺漏值的情況,可刪去含有缺漏值的資料筆:
data_dropped = data.dropna()
或是用該行所有資料的平均值來做補值填充的動作:
data['Height'].fillna(data['Height'].mean(), inplace=True)
最後得到填充後的結果:

dropna() 方法能夠對於缺漏值提供完整的處理方式,可設定這方法的 how 參數,指定資料的篩選方式:
how='any' : 只要該行 / 列有空值就刪除該行 / 列how='all' : 該行 / 列全部都是空值就刪除該行 / 列我們通常會需要針對需求取出資料中的數據,並做出篩選的動作,下面為我們的原始資料 df:

查詢所有 Score 欄位資料 > 50 的資料列,[ ] 中可放判斷式:
df[df["Score"] > 50]
Output :
查詢所有 Score 欄位資料 > 30 且 < 50 的資料列,判斷式若有兩個以上需要用 括號隔開:
df[(df["Score"] < 50) & (df["Score"] > 30)]
Output :

而篩選結果出來的都是 DataFrame 的物件,用下面就可以篩選並查詢分數介於 30 ~ 50 資料並查詢其 student 和 id 欄位,而後面接的 [ ] 中需要傳入 iterable 結果才會是 df 物件 ( 如 Output 所示 )。
下面是無傳入 iterable 的差別:
df[(df["Score"] < 50) & (df["Score"] > 30)][["id"]] # 有傳入iterable
Output :

df[(df["Score"] < 50) & (df["Score"] > 30)]["id"] # 無傳入iterable
Output :
由兩個 Output 的差異可知前者會回傳 df 物件,而後者回傳的是 Series 物件。
用 isin() 判斷該列是否存在資料 ( 傳入參數 ) 來做篩選,且 傳入參數 需要是 iterable ,該筆資料判斷完就回傳 True / False 並往下一筆資料繼續判斷:
df[df["student"].isin(["Deo"])] # df[[True, False, False]]
Output :
又或者是篩選出有空值的資料列:
df[df["id"].isnull()] # df[[False, True, False]]
Output :
Pandas 對於資料的查詢也有提供不同的方法:
利用 slice 切片法查詢資料列:
df[0:1] # 顯示第一筆資料列
df[:] # 顯示所有筆資料列
分別利用 loc 與 iloc 查詢資料 cell ,顯示第一筆資料列的成績 Cell,iloc[] 只能用 index ,而 loc 用 index 與欄位名稱搭配查詢如下 :
df.loc[0, "Score"]
df.iloc[0, 2]
loc[] 也可這樣查詢,注意這邊不同的語法會有回傳值的差異 :
df.loc[0:2, ["id", "student"]][["id"]] # 回傳df物件
df.loc[0:2, ["id", "student"]]["id"] # 回傳Series物件
利用傳入布林串列的方法查詢資料列,第 0 個元素給 True 第一筆資料列就會顯示,False 就不顯示:
df[[True, True, False]]
Output :

此外我們可以還可以用 Python 中的 lambda 表達式把我們函式 ( function ) 運用在每個資料上,每個資料都會被當作參數傳入經過預先定義好的函式,讓我們對資料的操作結合函式功能而更加靈活。
Lambda 判斷資料表資料 :
df = pd.DataFrame({"id": ["111", None, "333"],
                   "student": ["Deo", "Thomas", "Leo"],
                   "Score": [40, 90, 90]})
def score(x):
    if(x >= 60):
        return "passed"
    else:
        return "failed"
df["score"] = df.apply(lambda x:score(x["Score"]), axis=1)
df
上面的程式碼可以看到為了要判斷 Score 欄位的每個成績資料是否為及格,使用了 apply() 方法並用 lambda 匿名函數作為其參數。
apply() 方法就會沿著欄位增加的方向執行 score() 方法apply() 方法就會沿著列增加的方向執行 score () 方法
今天我們學到了:
掌握了對資料的操作技巧後,明天我們就會介紹所謂的資料預處理 ( Data Preprocessing ),這對機器學習來說是極其重要的步驟,它決定了我們模型訓練資料的品質,那我們就下篇文章見 ~
https://www.sharpsightlabs.com/blog/numpy-axes-explained/


 iThome鐵人賽