前幾天我們將之前的範例模組化了,接下來讓我們來新增一個可以畫圖表的page吧! 最終目標會以台股k線圖為主軸,至於工具則選用了plotly。
Plotly 是一個功能強大的資料可視化工具,它提供了各種視覺化類型,包括折線圖、柱狀圖、散點圖、熱圖等。它能夠以互動方式呈現資料,並支援許多自定義選項,使得資料分析和呈現更加靈活和豐富。
Plotly 和 Flask 的結合能夠實現在 Web 應用程式中展示 Plotly 圖表的功能。你可以使用 Plotly 在 Flask 應用程式中生成圖表,然後將這些圖表嵌入到網頁中,使用戶可以通過網頁與圖表進行互動。
在 Flask 中使用 Plotly,你需要將 Plotly 圖表的 HTML 代碼插入到 Flask 模板中,這樣瀏覽器就能夠正確顯示該圖表。你可以使用 Plotly 提供的 to_html() 函式將圖表轉換為 HTML 字串,然後在 Flask 的模板中使用該字串。
新增plotbar函式到views.py
import plotly.graph_objects as go
@views_bp.route('/plot')
@login_required
def plotbar():
# 建立 Plotly 圖表
user_id = current_user.get_id()
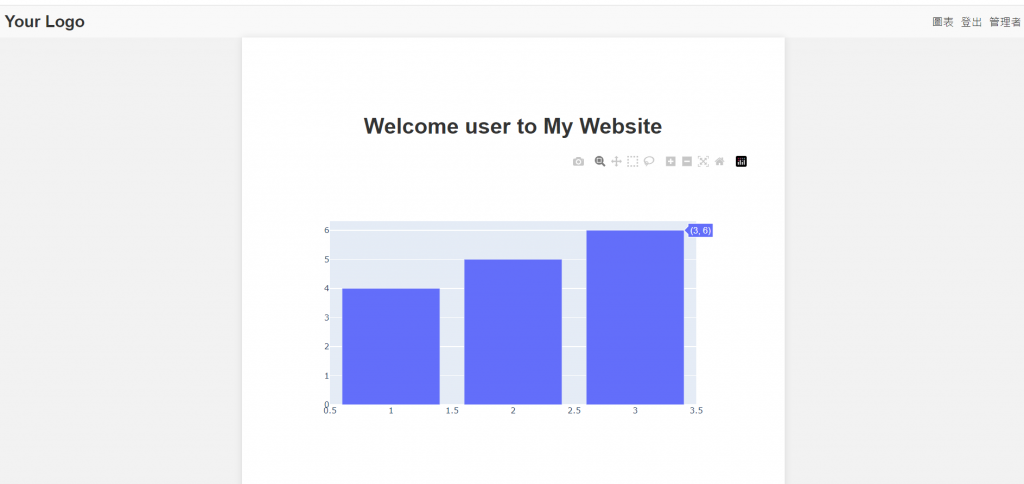
fig = go.Figure(data=go.Bar(x=[1, 2, 3], y=[4, 5, 6]))
# 將圖表轉換為 HTML 字串
plot_html = fig.to_html()
# 傳遞圖表 HTML 到模板中
return render_template('plot.html', plot_html=plot_html,user_id=user_id)
在上述示例中,我們建立了一個簡單的 Flask 應用程式,並在根路由處定義了一個視圖函式 plotbar()。在該函式中,我們建立了一個 Plotly 圖表,將其轉換為 HTML 字串,並將該字串傳遞到名為 plot.html 的模板中。在模板中,我們使用 plot_html 變數顯示該圖表的 HTML。
這樣,當用戶訪問根路由時,Flask 將呈現 plot.html 模板並將 Plotly 圖表嵌入到網頁中,用戶可以在瀏覽器中看到並與該圖表互動,此外也與之前的登入結合,要使用者登入後才能體驗此頁面。
新增plot.html到templates資料夾
<!DOCTYPE html>
<html>
<head>
    <title>Plotly with Flask</title>
    <script src="https://cdn.plot.ly/plotly-latest.min.js"></script>
    <link type="text/css" rel="stylesheet" href="{{ url_for('static', filename='css/style.css') }}" />

</head>
<body>

    {% include "base.html" %}

    <div class="container">
        <h1>Welcome {{user_id}} to My Website</h1>
        <div id="plot">{{ plot_html|safe }}</div>
        </div>

    <footer>
        © 2023 Your Company. All rights reserved.
    </footer>
    <!-- 在此處插入 Plotly 圖表的容器 -->
</body>
</html>
沒啥特別的但要記得要把<script src="https://cdn.plot.ly/plotly-latest.min.js"></script>引入。
修改base.html
<header>
    <div class="logo">
        Your Logo
    </div>
    <div class="nav">
        {% if current_user.is_authenticated and current_user.get_id()=='user' %}
        <a class="nav-link" href="/plot">圖表</a></li>
        <a class="nav-link" href="/logout">登出</a></li>
        <a class="nav-link" href="/manager">管理者</a></li>
        {% elif current_user.is_authenticated and current_user.get_id()!='user' %}
        <a class="nav-link" href="/plot">圖表</a></li>
        <a class="nav-link" href="/logout">登出</a></li>
        {% else %}
        <a class="nav-link" href="/login">登入</a></li>
        <a class="nav-link" href="/signup">註冊</a></li>
        {% endif %}

    </div>
</header>
使得登入後才會看到進入圖表的button
Plotly 與 Flask 的結合使你能夠在 Web 應用程式中展示動態和互動的資料可視化圖表,為用戶提供更豐富的數據呈現體驗,明天就讓我們來畫k線吧。