這篇一樣快速介紹過圖表的部分,先來瞅瞅圓餅圖。
def index():
    return rx.hstack(
        rx.chart(),
        rx.chart(polar = True)
    )
左方是折線圖,右方是圓餅圖。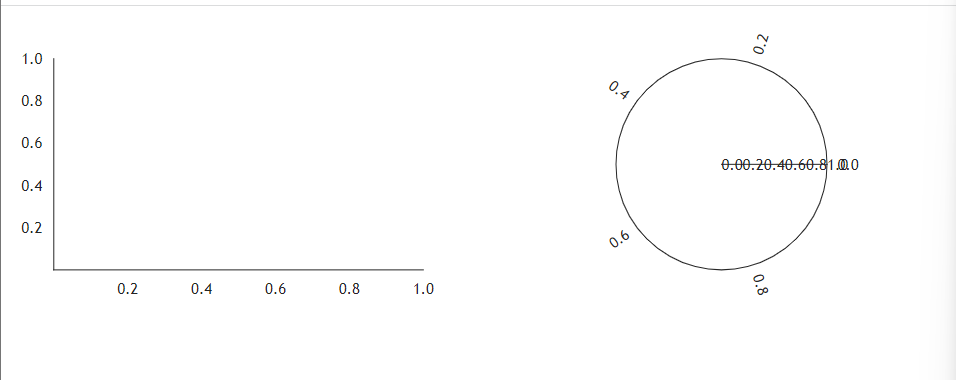
官網上也給出了一種顏色亮麗的版本。
def index():
    return rx.chart(
    rx.line(
        data=rx.data(
            "line", x=[1, 2, 3, 4, 5], y=[1, 2, 3, 4, 10]
        ),
        interpolation="natural",
        style={
            "data": {"stroke": "green", "strokeWidth": 2}
        },
    ),
    rx.scatter(
        data=rx.data(
            "scatter",
            # x, y 點位
            x=[1, 2, 3, 4, 5],
            y=[5, 12, 4, 6, 1],
            # 大小
            amount=[6, 5, 3, 9, 3],
        ),
        bubble_property="amount",
        min_bubble_size=0.0,
        max_bubble_size=10.0,
        style={"data": {"fill": "#00FFFF", "opacity": 0.5}},
    ),
    domainPadding={"x": 50, "y": 50},
)
這邊是官網的程式碼,為了美觀我就不動了,這邊分為line和scatter的部分,主要來說沒什麼問題,data、interpolation、style這幾個部分稍微注意一下即可。
簡單來說就是一個包裝元件。
def index():
    return rx.chart(
    rx.chart_group(
        rx.bar(
            data = rx.data(
                "bar",
                x=[0, 1, 2, 3, 4],
                y=[1, 2, 3, 4, 10],
            ),
        ),
        offset = 20.0,
        color_scale="qualitative",
    )
)
結果圖如下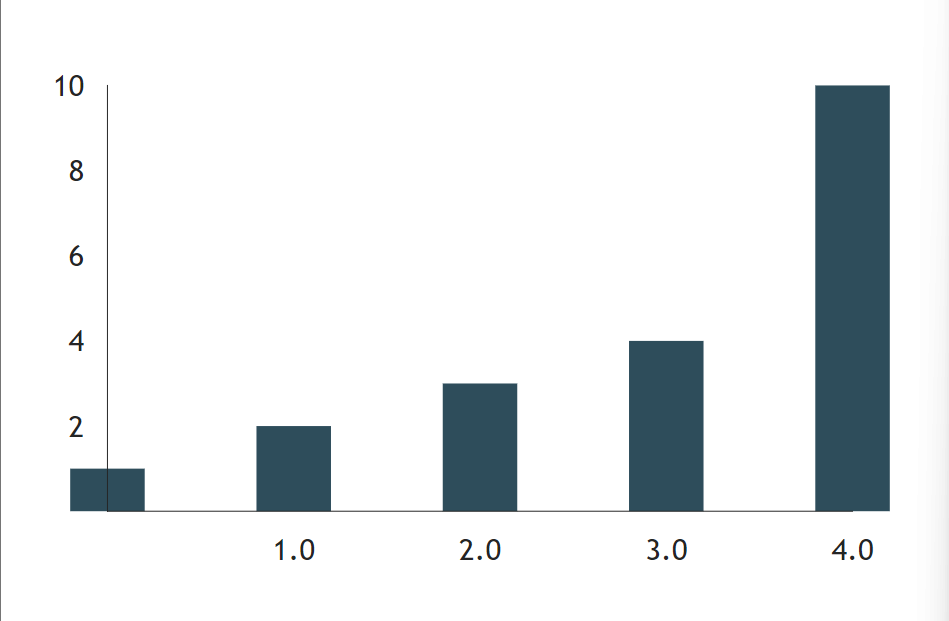
可以在rx.bar後面繼續撰寫rx.bar,別忘了,就行。
要注意的是x、y的長度要相同,stack是一個包裝元件,給定子元件後就可以呈現出來,不過和圖表不同的是,他不給予軸(x, y)或範圍的調整。
def index():
    return rx.chart_stack(
        rx.area(
            data = rx.data(
                "line",
                x = [1, 2, 3, 4, 5],
                y = [3, 4, 5, 6, 7]
            ),
        ),
        rx.area(
            data = rx.data(
                "line",
                x = [1, 2, 3, 4, 5],
                y = [5, 12, 4, 6, 1]
            ),
        ),
    )
結果圖如下。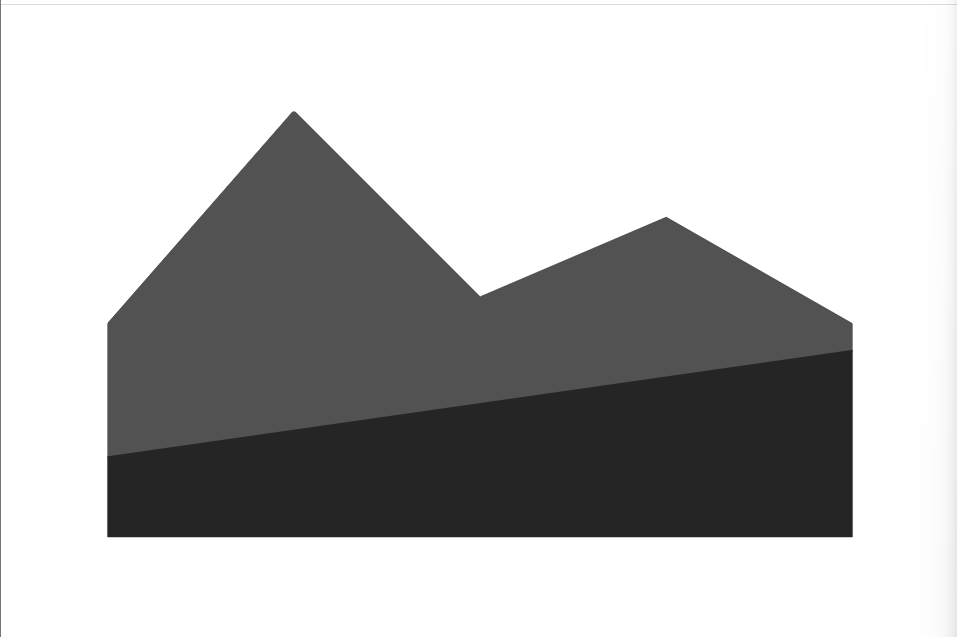
Area具備data屬性,是個需要用到dict的字典陣列,先簡單舉個例子。
def index():
    return rx.area(
        data = rx.data(
            'area',
            x = [1, 3, 5, 7, 9],
            y = [2, 4, 6, 8, 10]
        )
    )
結果如下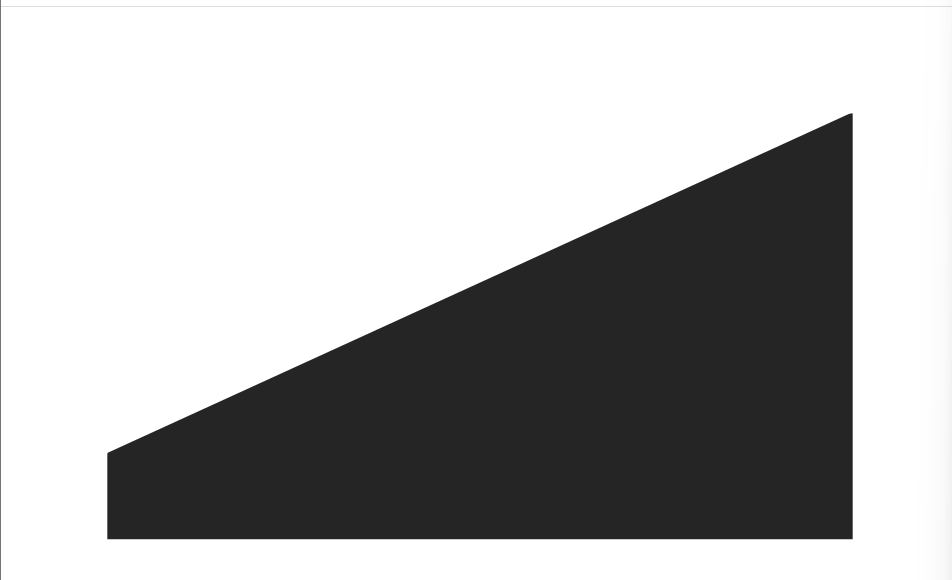
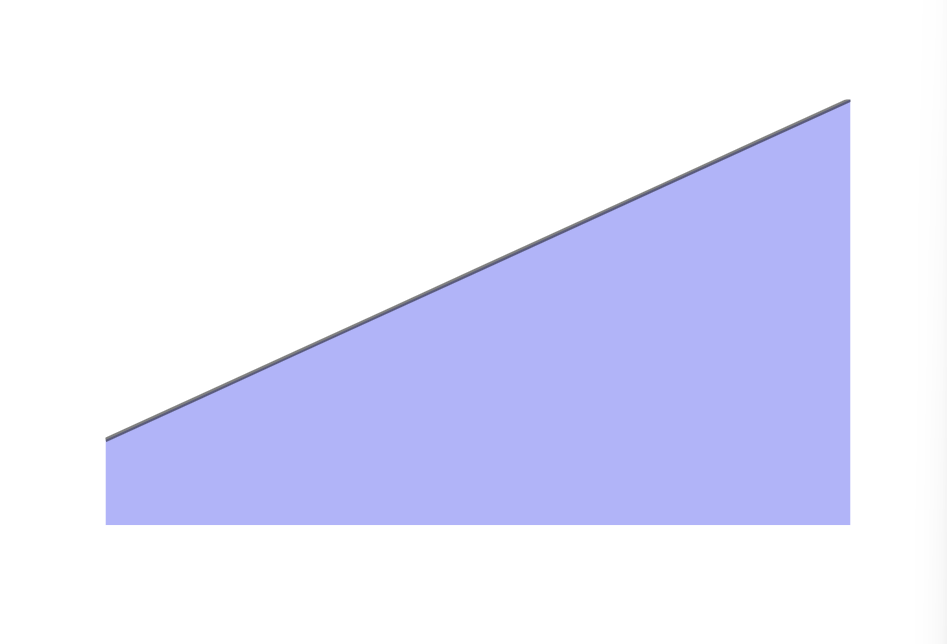
現在加上style
def index():
    return rx.area(
        data = rx.data(
            'area',
            x = [1, 3, 5, 7, 9],
            y = [2, 4, 6, 8, 10]
        ),
        style = {
            'data':{
                "fill": "rgb(107,99,246)",
                "stroke": "black",
                "strokeWidth": 2,
                "opacity": 0.5,
            }
        },
        interpolation="natural",
    )
結果圖如下
也可以加上scatter或是line混合使用。


 iThome鐵人賽