接下來是長條圖的部分,有關長條圖的都整理到這邊了。
boxplot使用data這個屬性,同時帶有x, y 這兩個字典鍵結,先看個例子。
def index():
    return rx.chart(
        rx.box_plot(
            data = rx.data(
                'box_plot',
                x = [2, 4, 6, 8, 10],
                y = [
                        [1, 3, 4, 7, 9],
                        [1, 3, 5, 7, 9, 11],
                        [0, 3, 4, 5, 11],
                        [1, 12, 3, 5, 7],
                        [3, 5, 7, 9, 12]
                    ]
            )
        ),
        domain_padding = {'x' : 15, 'y': 10}
    )
結果圖如下。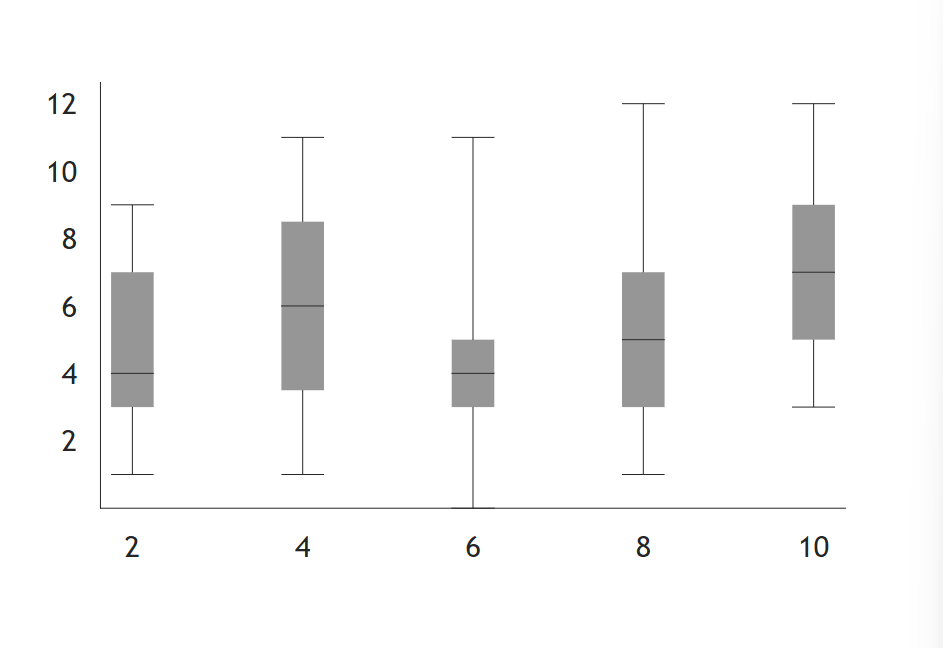
箱型圖有min、q1、median、q3、max這幾個點,也可以放置進style內
style = {
    'min': {'stroke': 'blue'},
    # ...
}
# stroke 是 css 裡代表邊框顏色。
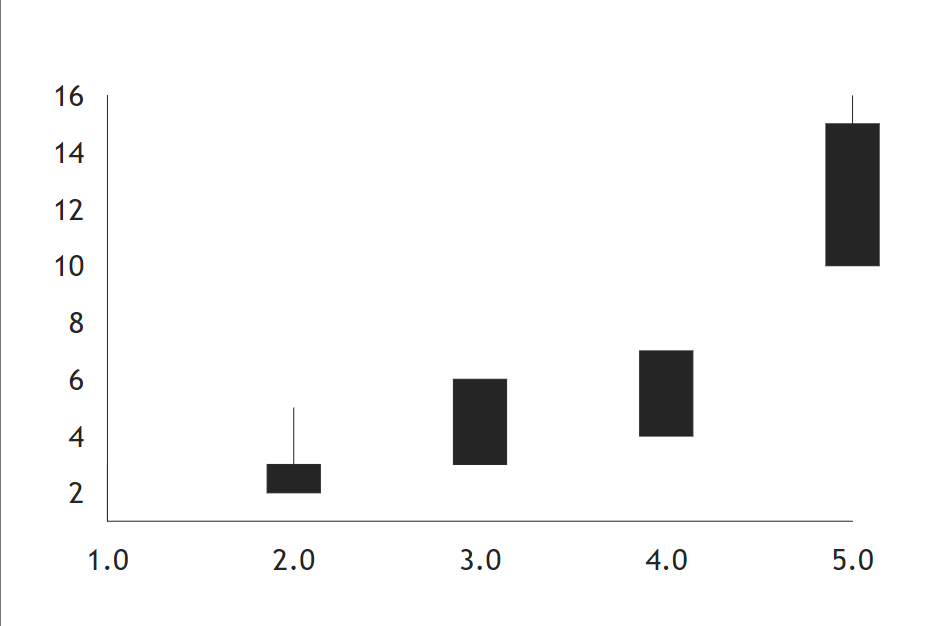
繪製K線圖用的,包括開盤與收盤,最高與最低價的字典陣列。
def index():
    return rx.chart(
        rx.candlestick(
            data = rx.data(
                "candlestick",
                x = [1, 2, 3, 4, 5],
                open = [1, 3, 6, 7, 15],
                close = [1, 2, 3, 4, 10],
                high = [3, 5, 6, 7, 16],
                low = [1, 2, 3, 4, 10],
            ),
        )
    )
自己寫出來的東西有點迷,就直接拿官網的範例吧。
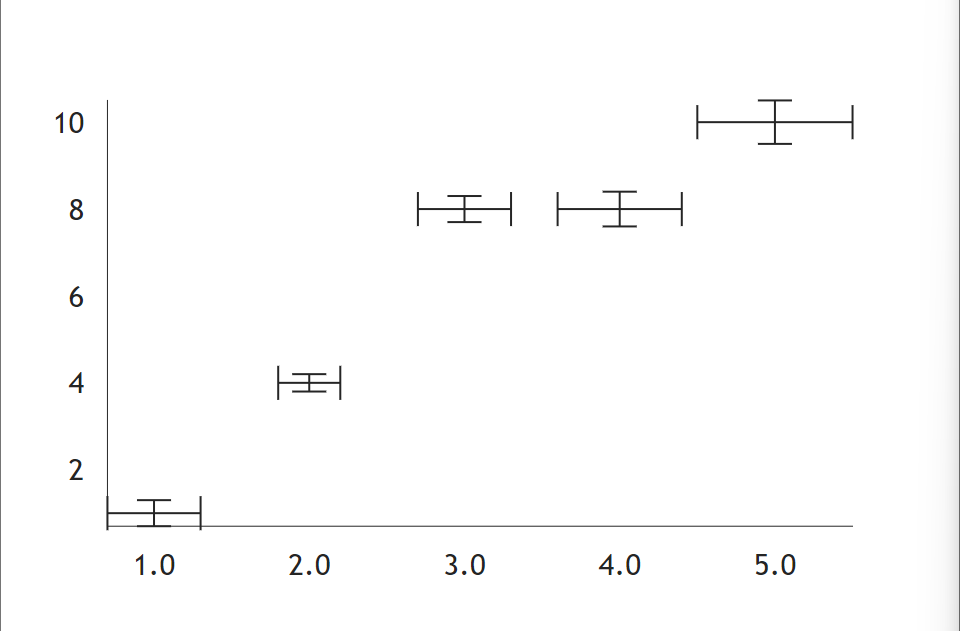
誤差條是把一個誤差範圍添加到途中的條(?),可以用在數據的基礎分布和不確定性範圍,以及差異性。
def index():
    return rx.chart(
    rx.error_bar(
        data = rx.data(
            "error_bar",
            x = [1, 2, 3, 4, 5],
            y = [1, 4, 8, 8, 10],
            error_x = [0.3, 0.2, 0.3, 0.4, 0.5],
            error_y = [0.3, 0.2, 0.3, 0.4, 0.5],
        ),
    ),
)
範例圖如下。
一樣是有data屬性的元件。
def index():
    return rx.chart(
        rx.line(
            data = rx.data(
                'line',
                x = [0, 1, 2, 3, 4, 5],
                y = [5, 4, 3, 2, 1, 0]
            ),
            interpolation = 'natural',
            style = {'data': {'stroke': 'blue'}},
        ),
        domain_padding = {'x': 0, 'y': 5}
    )
這樣就是一條斜直線了。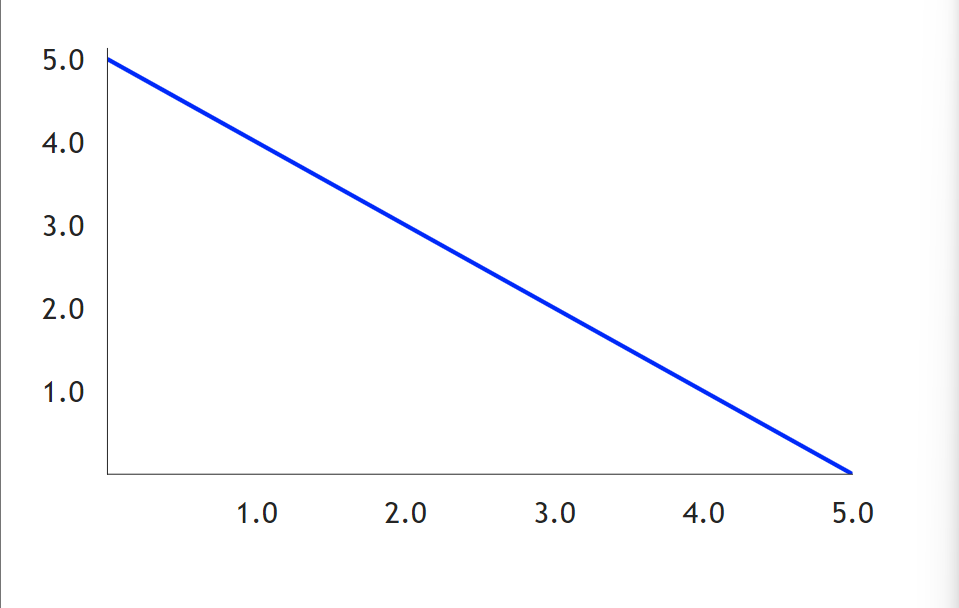


 iThome鐵人賽