完成科技類股其中一塊板塊:Software—Infrastructure的hotmap
// hotMap.vue
<template>
<NuxtLayout name="header">
<template #main>
<div>
<h2>股票熱區地圖</h2>
<ClientOnly>
<highcharts
v-if="check"
class="w-[1000px] mx-auto my-10"
:constructor-type="'chart'"
:options="chartOptions"
/>
</ClientOnly>
</div>
</template>
</NuxtLayout>
</template>
<script setup>
import charts from 'highcharts'
const axios = inject('axios')
definePageMeta({
layout: false,
})
// key
const fmp = import.meta.env.VITE_KEY_FMP
// api
const softwareApi = `https://financialmodelingprep.com/api/v3/stock-screener?marketCapMoreThan=1000000000&volumeMoreThan=50000§or=Technology&industry=Infrastructure÷ndMoreThan=0&betaLowerThan=1.5&limit=10&apikey=${fmp}`
const stockData = ref()
const getData = () => {
axios
.get(softwareApi)
.then((res) => {
console.log(res.data)
stockData.value = res.data
})
.catch((rej) => {
console.log(rej)
})
}
const stockName = computed(() => {
const data = stockData.value
? stockData.value.map((v) => v.symbol).join(',')
: undefined
return data
})
onMounted(() => {
getData()
})
const stockByVolumeApi = computed(() => {
return `https://financialmodelingprep.com/api/v3/quote/${stockName.value}?apikey=${fmp}`
})
const stockByVolume = ref()
const chartData = computed(() => {
const data = stockByVolume.value
? stockByVolume.value.map((v) => {
return {
id: v.name,
name: v.symbol,
parent: 'Technology',
value: v.volume,
}
})
: undefined
return [
    {
      id: 'Technology',
      name: 'Technology',
      color: '#56a556',
},
...data,
]
})
watchEffect(() => {
if (stockName.value) {
axios
.get(stockByVolumeApi.value)
.then((res) => {
console.log(res)
stockByVolume.value = res.data
})
.catch((rej) => {
console.log(rej)
})
}
})
const check = ref(false)
const chartOptions = computed(() => {
return {
series: [{
name: 'Tech',
type: 'treemap',
layoutAlgorithm: 'squarified',
allowDrillToNode: true,
animationLimit: 1000,
dataLabels: {
enabled: false
},
levels: [{
level: 1,
dataLabels: {
enabled: true
},
borderWidth: 3,
levelIsConstant: false
}, {
level: 1,
dataLabels: {
style: {
fontSize: '14px'
}
}
}],
accessibility: {
exposeAsGroupOnly: true
},
data: chartData.value
}],
subtitle: {
text: 'Software—Infrastructure',
align: 'left'
},
title: {
text: '股票熱區地圖',
align: 'left'
}
}})
今天先做一個二層的樹狀圖
第一層是Technology
第二層是Technology底下Software—Infrastructure
先透過API把10億美金以上市值的科技股前10大篩選出來
用map取名字之後
在透過另一支API去抓這些公司的name,volume
跟第一層的object
{
id: 'Technology',
name: 'Technology',
color: '#56a556',
}
組成一個陣列
放到series.data即可
股票熱區(treemap)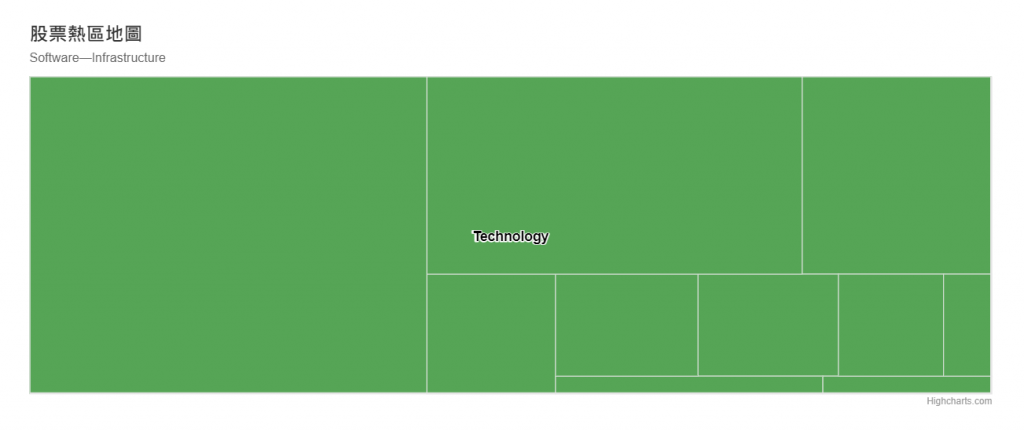
點擊圖後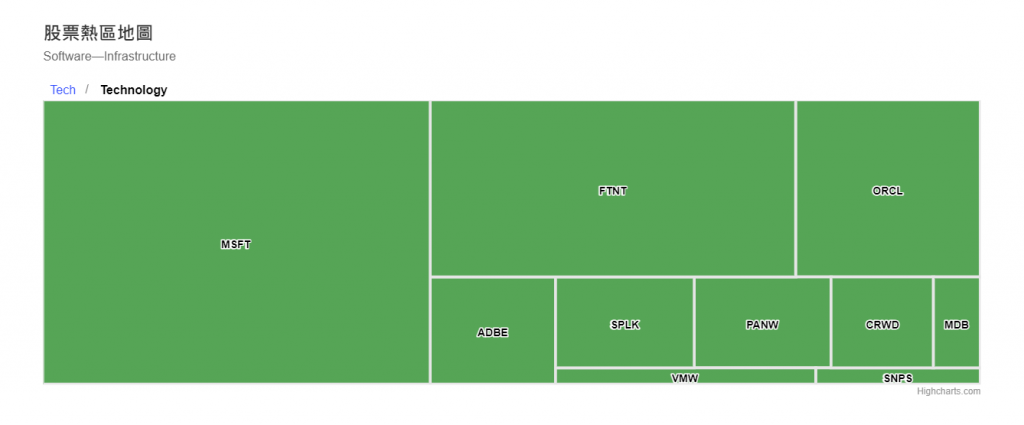
還有蠻多細節沒有調整
可能比較傷眼睛
(股票漲跌幅影響顏色深淺,漲跌幅數據,多圖集合,第三層樹狀圖)
明天繼續!!