今天來用 Grafana 的內建功能 Alerting 來做 Alert
來解決服務下線或負載異常 或惡搞 Alert 來 On call 同事 的狀況沒有人知道
Alert Rule 是 Alert Manager 內用來制定 Alert 的觸發條件的
能夠透過 Prometheus 的 Metric 和 Loki 的 Log 來當指標作為觸發條件
這次透過 Probe_Success Metric 的 Kubeadm Control Plane Health Check 來測試
廢話不多說馬上到 Grafana 網頁上透過左側的列表來找到 Alerting -> Alert Rules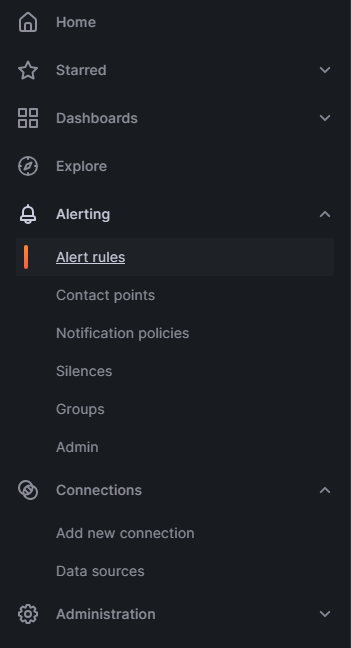
接著按 New Alert Rule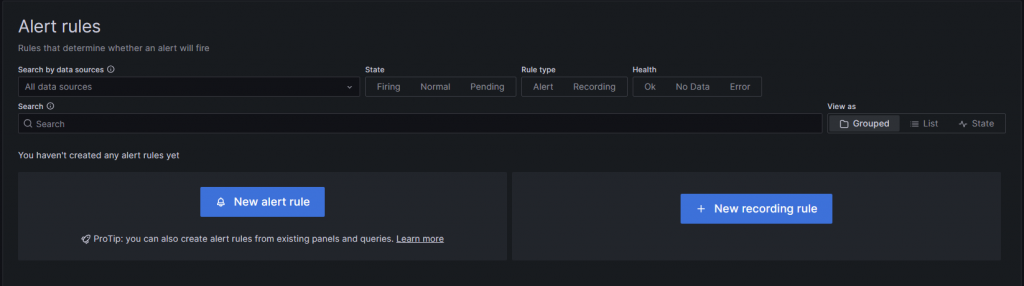
接著先設定 Alert Rule Name 還有條件
這邊選擇 Probe_Success 為 Metric
再透過 Label 來篩選要抓的 Instance 這邊指定 lke-main.ironman.test
設定完就可以右邊的 Run queries 來先找找看這個 Metric 的值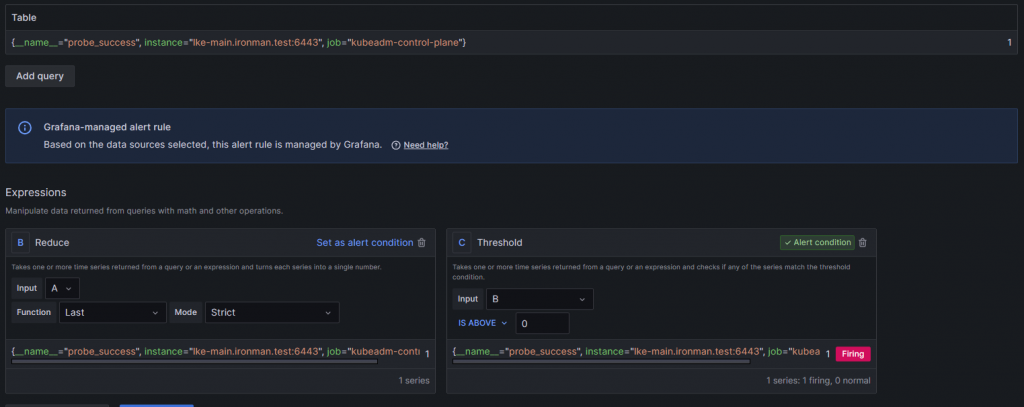
可以看到除了抓出了 Metric 的值 也在下方更新了兩種 Alert 的 Condition
這邊要用 C 的 Threshold 來做為主要的 Condition
這邊來設定條件為低於 1 時 因 Probe_Success 值為 0 的時候就是 Blockbox Exporter 探測不到 Target 的值
也就是說 Kubeadm 的 Control Plane 死了需要有人去救他
在條件的部分大致上是這樣 接下來設定存放 Role 的資料夾和設定探測時間和維持時間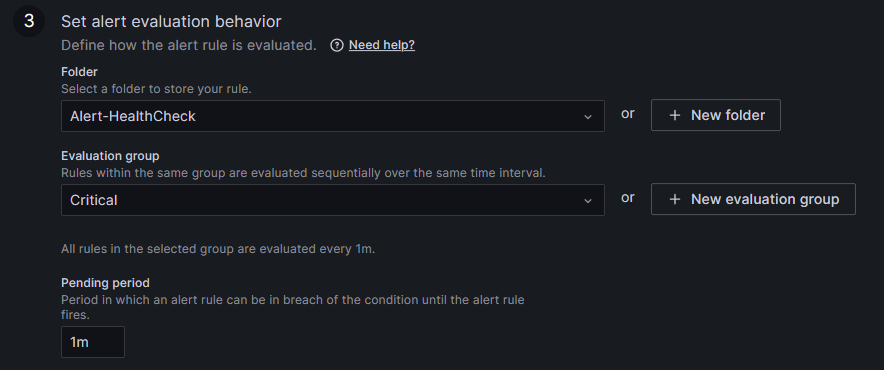
資料夾的部分建一個存放 Alert 且分類是 Health Check 的資料夾來放
Evaluation group 是探測時間 在一個群組內設定共通的時間來進行探測
Pending period 是維持時間 就是在探測後條件觸發 需要維持多久的時間才會發送 Alert 到 Contact Point 上
這邊我的設定是
基本上設定完這些後就可以儲存了 按右上角的 Save Rule and exit 離開
Contact Point 是設定 Grafana 的通知管道也就是 Grafana 可以透過哪些管道來通知使用者
可以選擇 E-Mail Slack Line Teams ... 等一大堆軟體
但這次就用最簡單也蝦趴的 Discord 來做看看
先開一個要使用的伺服器起來 接著對伺服器內的頻道按右鍵 按下編輯頻道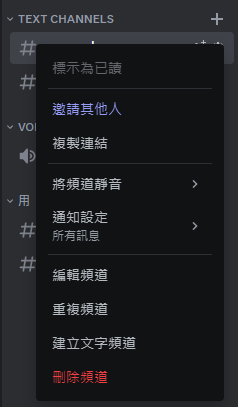
按進整合 再點建立 Webhook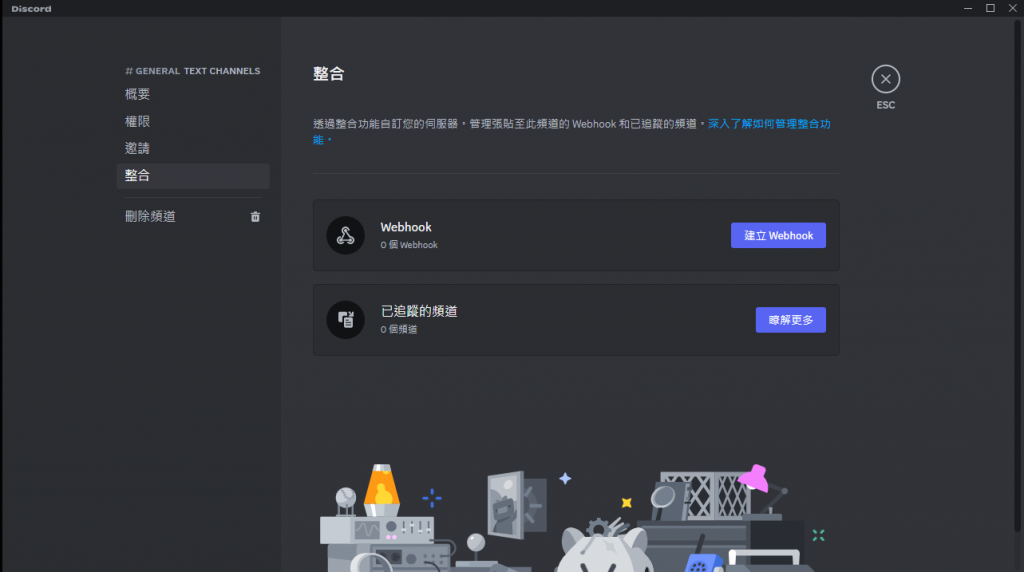
建立後再按下複製 Webhook 網址 等等要透過這個 Webhook 網址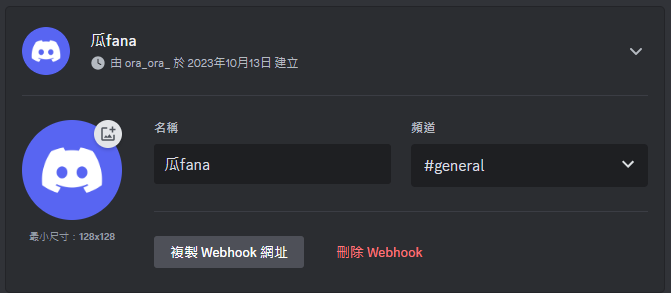
從左側選單打開 Alerting -> Contact Points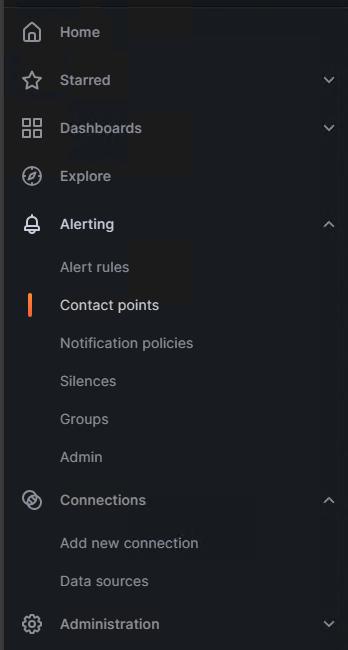
進來後再按下 Add Contact Point 新增剛剛設定的 Discord 進來設定
把剛剛的 Webhook 網址貼上來就可以了 可以透過右邊的 Test 來讓 Grafana 發一個測試用的 POST 到 Webhook上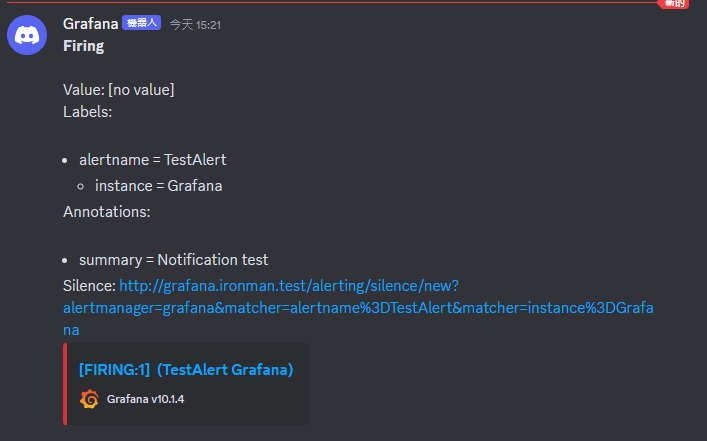
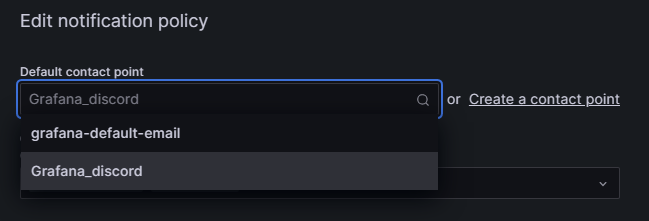
一樣透過左側選單 Alerting -> Notification Polices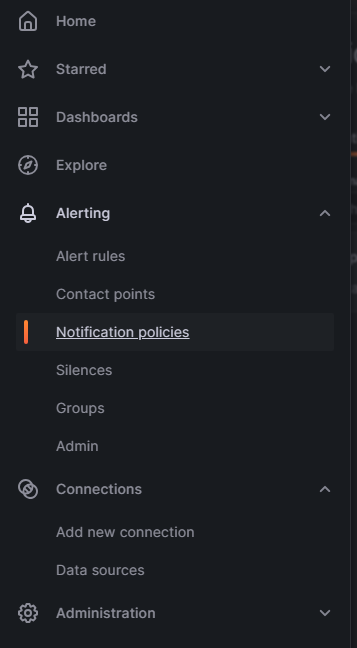
接著這邊改一下預設的 Policy 就可以了
預設的 E-Mail 因為沒有設定 SMTP 所以是無法使用的
所以改成剛剛設定好的 Discord Webhook 來做使用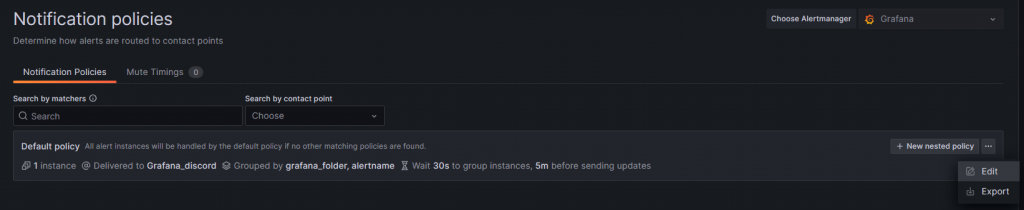
這樣子就設定好所有東西了 接著來測試
我的測試方式是在 kubeadm 的 Control plane 上透過 IPTABLES 來設定防火牆擋掉 Prometheus 的探測
這樣子 Probe_Success 的 Metric 值就會由 1 降為 0 去觸發 Alert Role
再等到等待時間滿了後就會發送 Alert 到 Discord 上
這邊是 IPTABLES 使用的指令 針對 Prometheus 的 IP 擋住 Control Plane 的 Port
root@lke-main:~# iptables -A INPUT -s 10.0.0.5 -p tcp --dport 6443 -j DROP
接著來看看發生什麼事
這邊是 IPTABLES 設定後幾秒的狀態 可以看到 Alert Role 已經在 Pending 了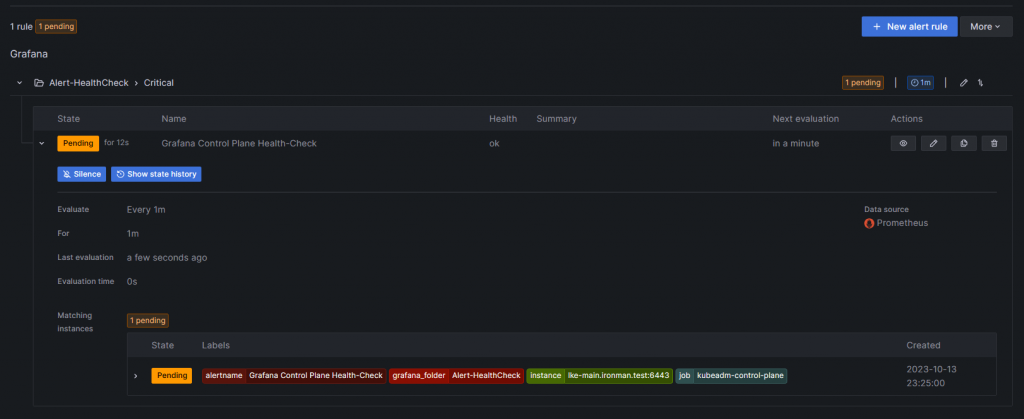
這是過了1分鐘 也就是等待時間滿後發出 Alert 的狀態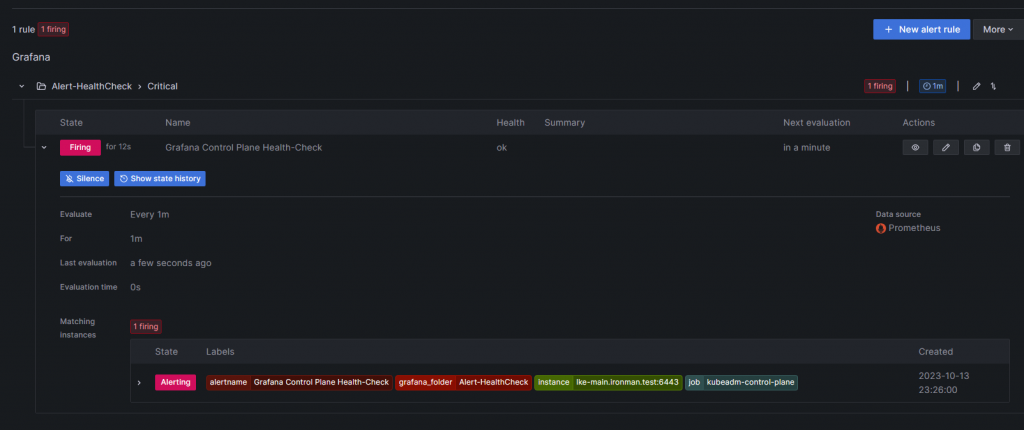
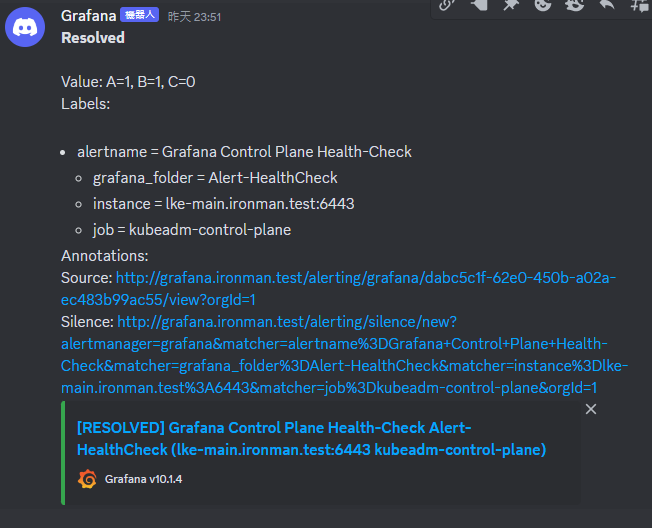
這邊是 Discord 看到的狀態截圖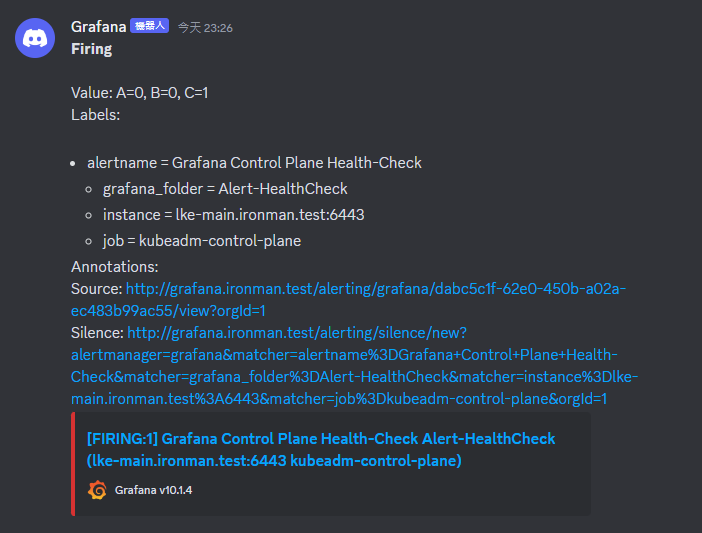
測試完後再透過指令把 IPTABLES 剛剛加上去的防火牆拔掉就可以還原了
root@lke-main:~# iptables -D INPUT -s 10.0.0.5 -p tcp --dport 6443 -j DROP
恢復正常後 Grafana 會再寄一個恢復的訊息過來長這樣