機器如何學習?
<簡單線性回歸 Simple Linear Regression>
任務:用年資預測薪水
import pandas as pd
url = "https://raw.githubusercontent.com/GrandmaCan/ML/main/Resgression/Salary_Data.csv"
data = pd.read_csv(url)
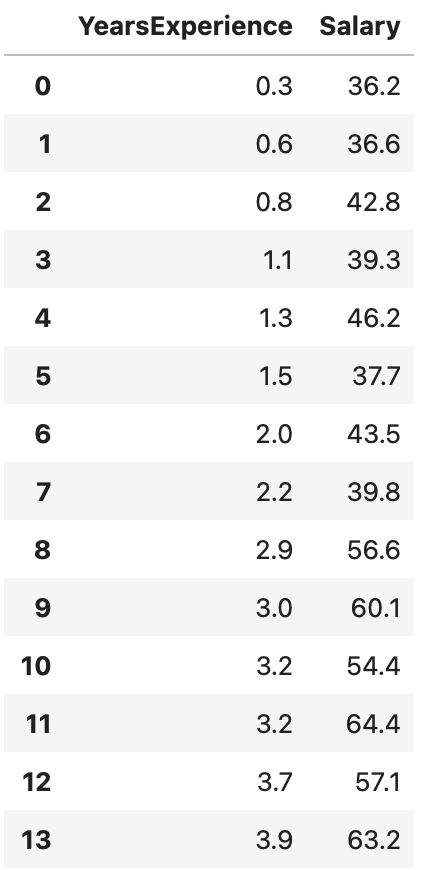
data
x = data["YearsExperience"]
y = data["Salary"]
pip install wget
import wget
wget.download("https://github.com/GrandmaCan/ML/raw/main/Resgression/ChineseFont.ttf")
import matplotlib as mpl
from matplotlib.font_manager import fontManager
fontManager.addfont("Chinesefont.ttf")
#設定字體
mpl.rc("font", family = "Chinesefont")
畫圖:
import matplotlib.pyplot as plt
plt.scatter(x, y, marker = "x", color = "r")
plt.title("薪水-年資“)
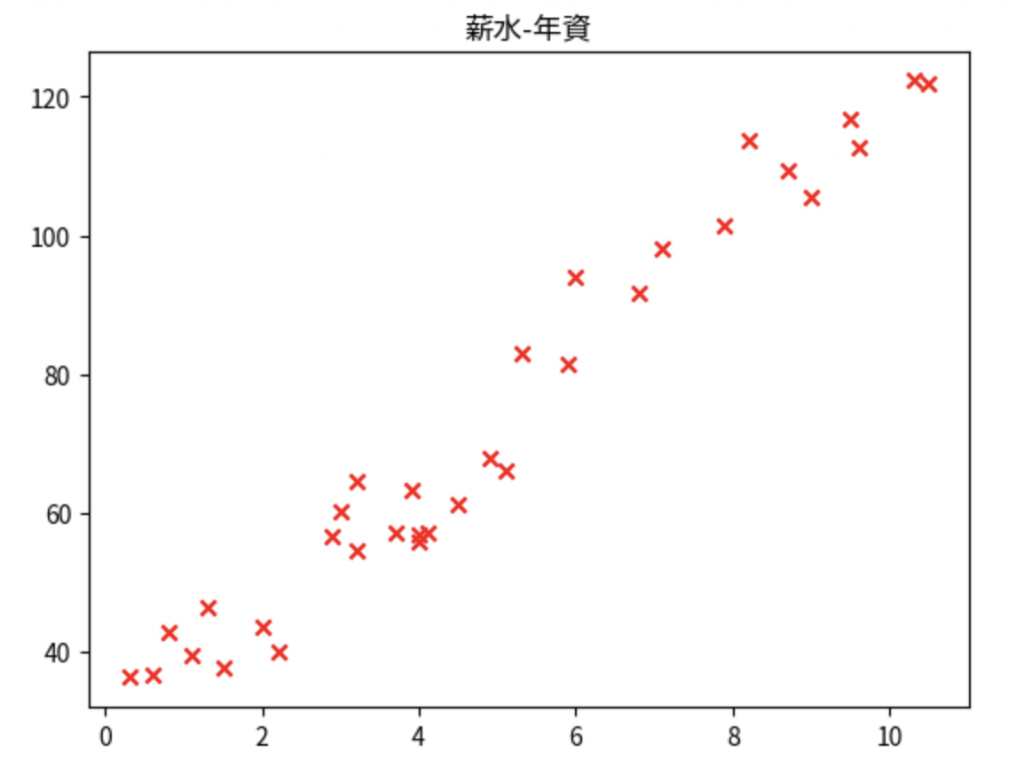
w = 0
b = 0
y_pred = w*x + b
plt.plot(x, y_pred)
plt.show()
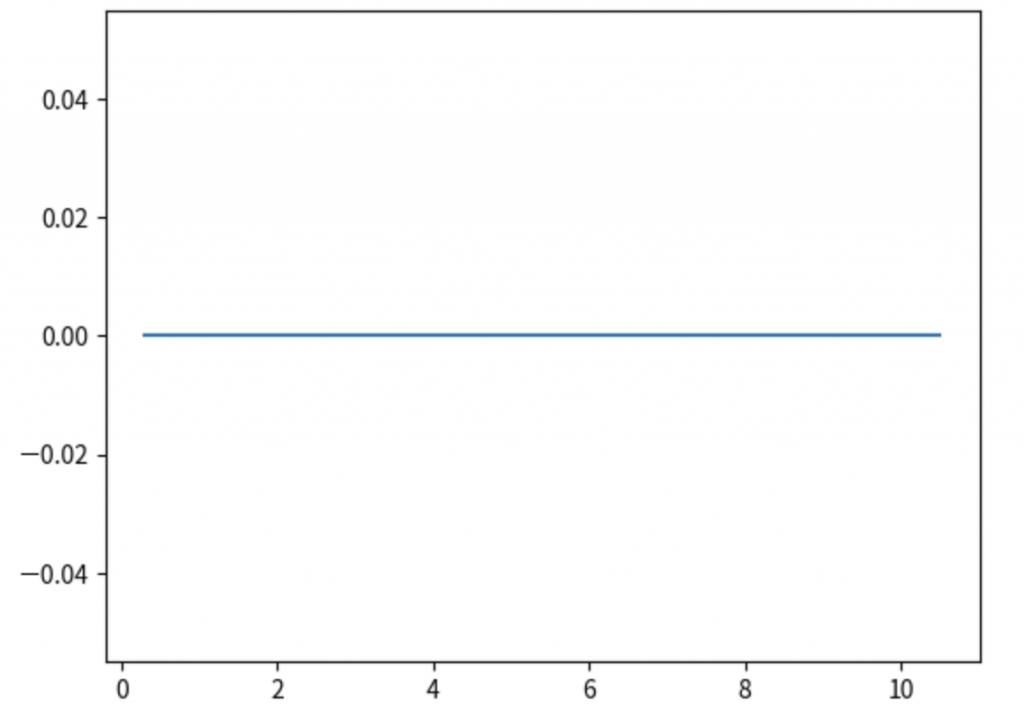
補上原始資料點:
w = 0
b = 0
y_pred = w*x + b
plt.plot(x, y_pred, color = "blue", label = "預測線")
plt.scatter(x, y, marker = "x", color = "red", label = "真實數據")
plt.title("薪水-年資")
plt.xlabel("年資")
plt.ylabel("月薪(千)")
plt.legend()
plt.show()
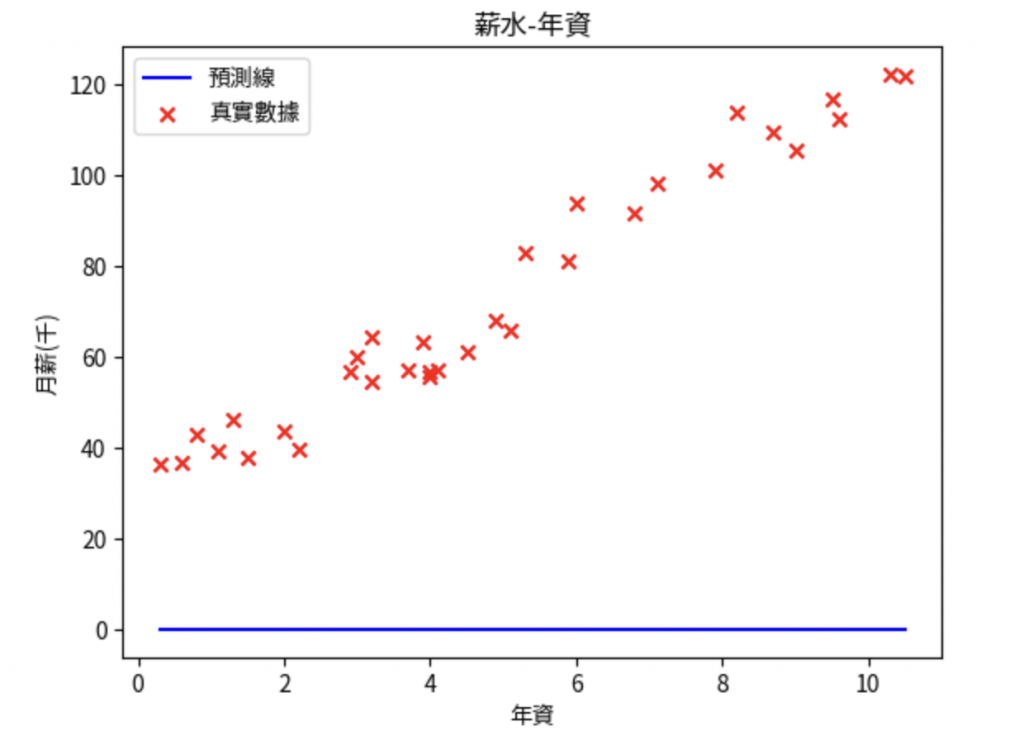
目標:找出最符合資料點的直線
def plot_pred(w, b):
    y_pred = w*x + b
    plt.plot(x, y_pred, color = "blue", label = "預測線")
    plt.scatter(x, y, marker = "x", color = "red", label = "真實數據")
    plt.title("薪水-年資")
    plt.xlabel("年資")
    plt.ylabel("月薪(千)")
    plt.legend()
    plt.show()

plot_pred(0, 0) #輸入(0, 0),輸出圖片與上述相同
#cost function
w = 10
b = 0
y_pred = w*x + b
cost = (y - y_pred)**2
cost
cost.sum() #輸出:19884.080000000005
cost.sum() / len(x) #距離平方的平均:602.547878787879
cost的輸出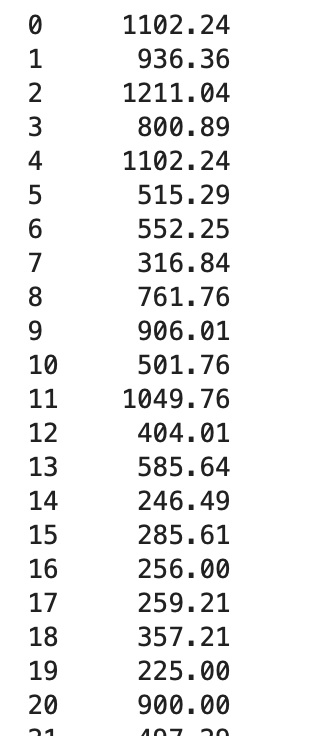
將上述運算寫成函式:
def compute_cost(x, y, w, b):
    y_pred = w*x + b
    cost = (y - y_pred)**2
    cost =  cost.sum() / len(x)

    return cost

compute_cost(x, y, 10, 10) #輸出:227.88121212121214
如果w的值從-100~100時,會有什麼樣的結果:
costs = []
for w in range(-100, 101):
    cost = compute_cost(x, y, w, 0)
    costs.append(cost)
costs

plt.scatter(range(-100,101), costs)
plt.show()
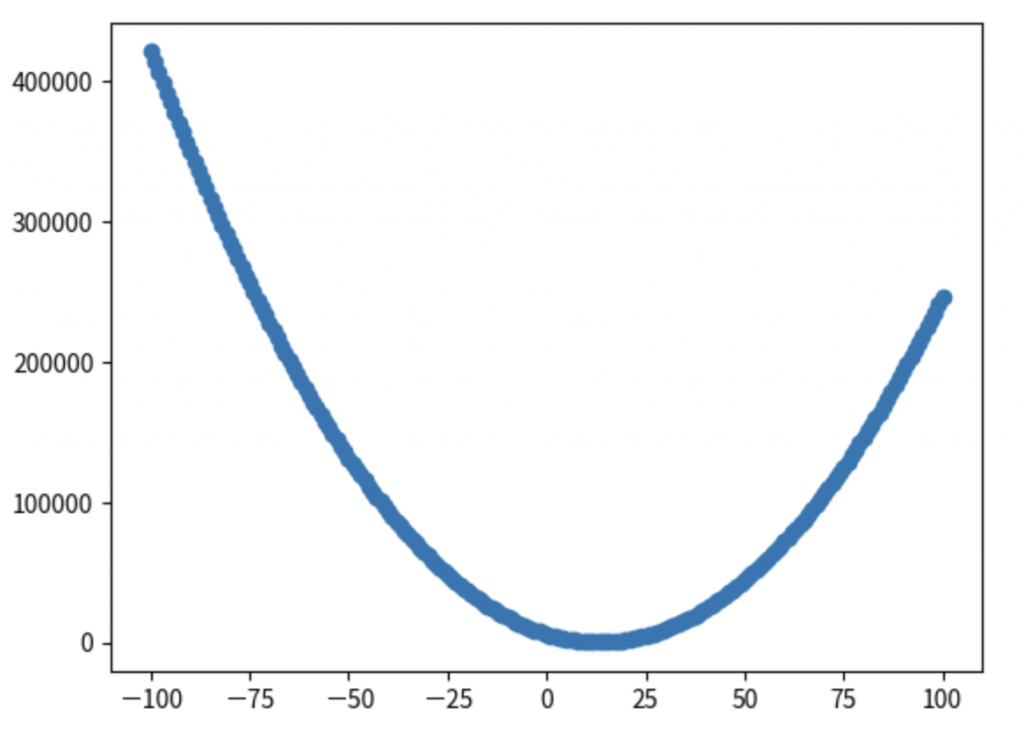
如果w 和 b 都範圍從-100~100的話?
ws = np.arange(-100, 101)
bs = np.arange(-100, 101)
costs = np.zeros((201, 201))

i = 0
for w in ws:
    j = 0
    for b in bs:
        cost = compute_cost(x, y, w, b)
        costs[i, j] = cost
        j = j + 1
    i = i + 1

costs
畫出w, b所對應到的cost
ax = plt.axes(projection = "3d")
ax.xaxis.set_pane_color((0, 0, 0))
ax.yaxis.set_pane_color((0, 0, 0))
ax.zaxis.set_pane_color((0, 0, 0))
ax.view_init(45, -120)
plt.figure(figsize =  (7,7))

b_grid, w_grid = np.meshgrid(bs, ws)

ax.plot_surface(w_grid, b_grid, costs, cmap = "Spectral_r", alpha = 0.7)
ax.plot_wireframe(w_grid, b_grid, costs, color = "black", alpha = 0.1)
ax.scatter(ws[w_index], bs[b_index], costs[w_index, b_index], color = "red", s = 40)
ax.set_title("w_b_對應的cost")
ax.set_xlabel("w")
ax.set_ylabel("b")
plt.show()
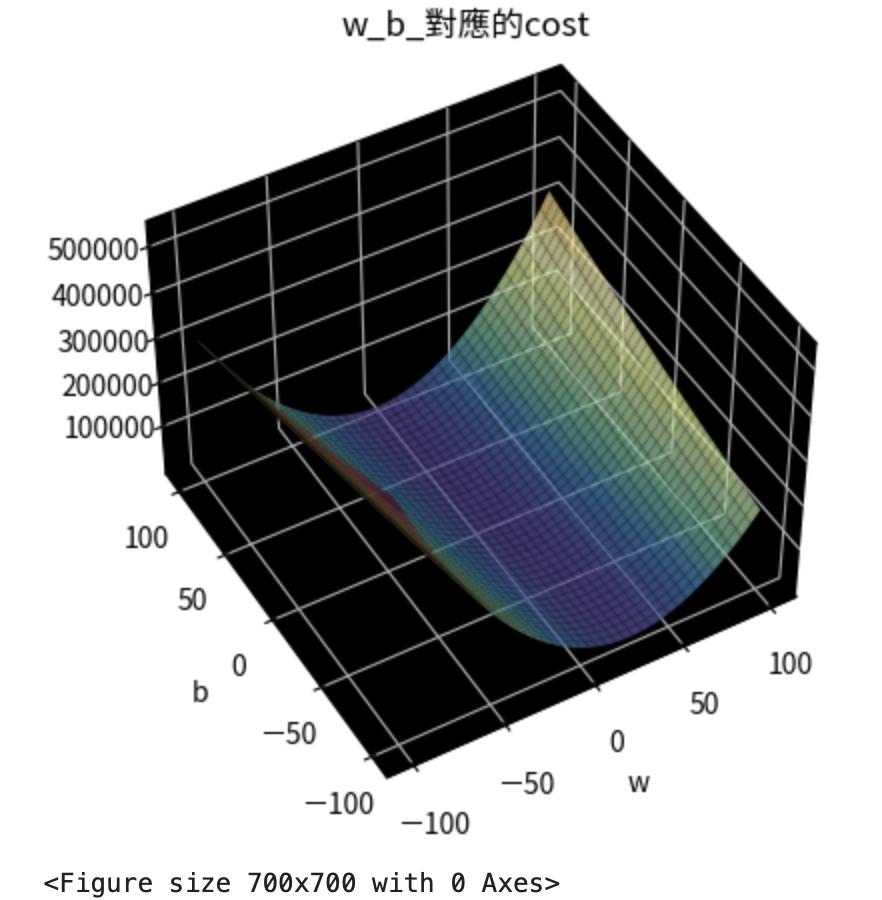
找出cost最低點所對應到的(w, b)
w_index, b_index = np.where(costs == np.min(costs))
print(f"當w = {ws[w_index]}, b = {bs[b_index]},會有最小cost: {costs[w_index, b_index]}")
#輸出:當w = [9], b = [29],會有最小cost: [32.69484848]
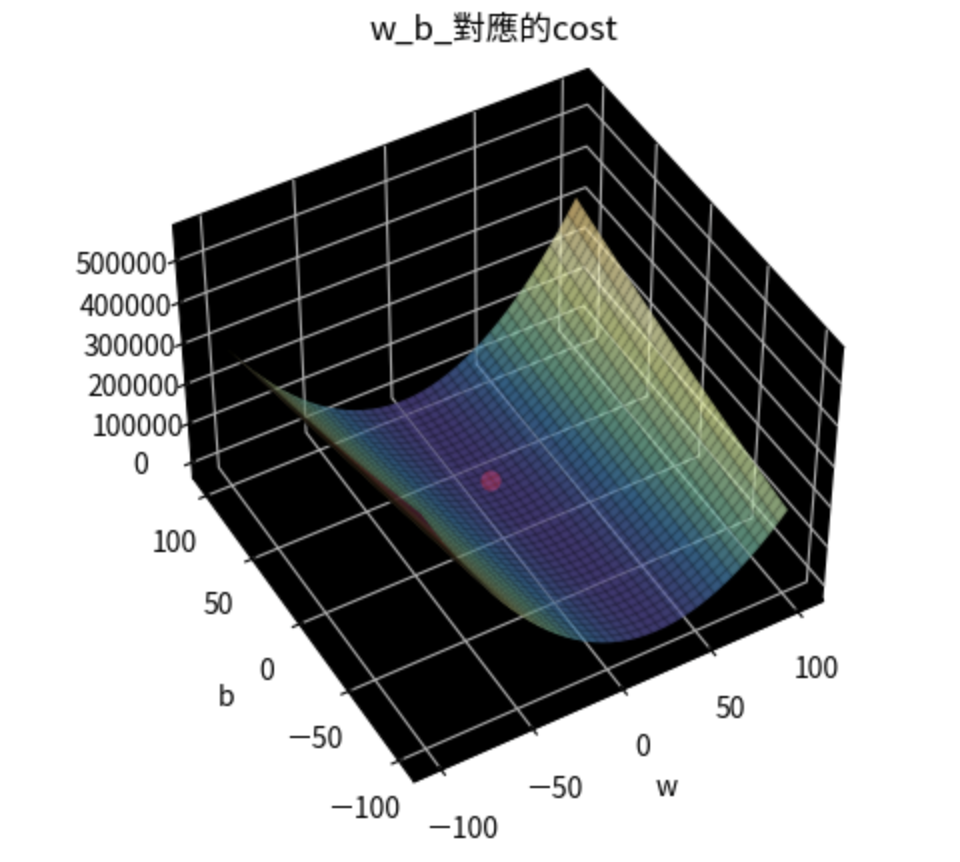
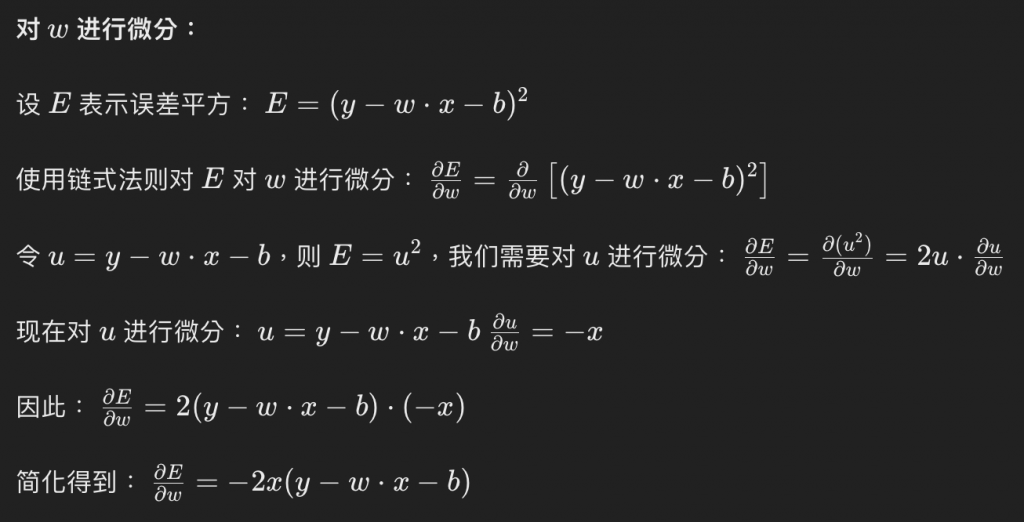
=>下一篇繼續更新如何有效率找出最佳的w和b的部分
