在本節中,我們將深入了解量化投資中至關重要的部分——回測。透過回測,我們可以在歷史數據上測試交易策略的有效性,評估其風險和收益特性。我們將介紹兩個流行的Python回測框架:Backtrader和Zipline,並學習如何使用它們來進行策略回測。那因為這兩個中 Backtrader 可以方便安裝在 Colab 上但是 Zipline 不行等等問題, 所以我們還是依照 Backtrader 為主, 至於 Zipline 則放在 Appendix-2 裡,完整 Zipline 程式可直接到 Appendix 2-H 去看與 Backtrader 做比較。
今日 Colab
回測(Backtesting)是指在歷史數據上測試交易策略,以評估其在過去的表現。透過回測,我們可以:
在Colab中安裝Backtrader:
!pip install backtrader
在Backtrader中,您需要繼承bt.Strategy類,並實現策略的邏輯。
import backtrader as bt

class SmaCrossStrategy(bt.Strategy):
    params = dict(
        sma_short_period=10,
        sma_long_period=50,
    )

    def __init__(self):
        self.sma_short = bt.ind.SMA(period=self.p.sma_short_period)
        self.sma_long = bt.ind.SMA(period=self.p.sma_long_period)
        self.crossover = bt.ind.CrossOver(self.sma_short, self.sma_long)

    def next(self):
        if not self.position:
            if self.crossover > 0:
                self.buy()
        elif self.crossover < 0:
            self.sell()
使用yfinance獲取數據,並轉換為Backtrader的數據格式。
import yfinance as yf
import pandas as pd

data = yf.download('AAPL', start='2020-01-01', end='2021-01-01')
data_bt = bt.feeds.PandasData(dataname=data)
cerebro = bt.Cerebro()
cerebro.addstrategy(SmaCrossStrategy)
cerebro.adddata(data_bt)
cerebro.broker.setcash(100000.0)
cerebro.run()
打印最終資產淨值:
print(f'最終資產淨值: {cerebro.broker.getvalue():.2f}')
繪製回測結果:
cerebro.plot()
cerebro.plot()
#https://www.roelpeters.be/how-to-use-backtrader-plots-in-python-notebooks/
import matplotlib.pyplot as plt
%matplotlib inline
plt.rcParams['figure.figsize'] = [15, 12]
plt.rcParams.update({'font.size': 12})
cerebro.plot(iplot = False)
cerebro.broker.setcommission(commission=0.001)  # 設置手續費為0.1%
cerebro.broker.set_slippage_perc(0.001)         # 設置滑點為0.1%
使用Backtrader的分析器(Analyzer)獲取更多的性能指標,例如以下我們加入 Sharpe 值與 Drawdown 值。
cerebro.addanalyzer(bt.analyzers.SharpeRatio, _name='sharpe')
cerebro.addanalyzer(bt.analyzers.DrawDown, _name='drawdown')
完整程式:
import backtrader as bt
import yfinance as yf

# 定義策略
class SmaCrossStrategy(bt.Strategy):
    params = dict(
        sma_short_period=10,
        sma_long_period=50,
    )

    def __init__(self):
        self.sma_short = bt.ind.SMA(period=self.p.sma_short_period)
        self.sma_long = bt.ind.SMA(period=self.p.sma_long_period)
        self.crossover = bt.ind.CrossOver(self.sma_short, self.sma_long)

    def next(self):
        if not self.position:
            if self.crossover > 0:
                self.buy()
        elif self.crossover < 0:
            self.close()

# 獲取數據
data = yf.download('AAPL', start='2020-01-01', end='2021-01-01')
data_bt = bt.feeds.PandasData(dataname=data)

# 設置回測環境
cerebro = bt.Cerebro()
cerebro.addstrategy(SmaCrossStrategy)
cerebro.adddata(data_bt)
cerebro.broker.setcash(100000.0)
cerebro.broker.setcommission(commission=0.001)
cerebro.addanalyzer(bt.analyzers.SharpeRatio, _name='sharpe',
                    timeframe=bt.TimeFrame.Days, annualize=True, riskfreerate=0.01)
cerebro.addanalyzer(bt.analyzers.DrawDown, _name='drawdown')
cerebro.addanalyzer(bt.analyzers.TradeAnalyzer, _name='trade_analyzer')

# 執行回測
results = cerebro.run()
sharpe = results[0].analyzers.sharpe.get_analysis()
drawdown = results[0].analyzers.drawdown.get_analysis()
trade_analyzer = results[0].analyzers.trade_analyzer.get_analysis()

# 打印結果
print(f"最終資產淨值: {cerebro.broker.getvalue():.2f}")
if sharpe.get('sharperatio') is not None:
    print(f"夏普比率: {sharpe['sharperatio']:.2f}")
else:
    print("夏普比率無法計算,請檢查策略和數據。")

print(f"最大回撤: {drawdown.max.drawdown:.2f}%")
print(f"總交易次數: {trade_analyzer.total.closed}")

# 繪製圖表
## 如果在 local machine python terminal 之上:
cerebro.plot()

## 如果在 Colab 之上:
#https://www.roelpeters.be/how-to-use-backtrader-plots-in-python-notebooks/
import matplotlib.pyplot as plt
%matplotlib inline
plt.rcParams['figure.figsize'] = [15, 12]
plt.rcParams.update({'font.size': 12})
cerebro.plot(iplot = False)
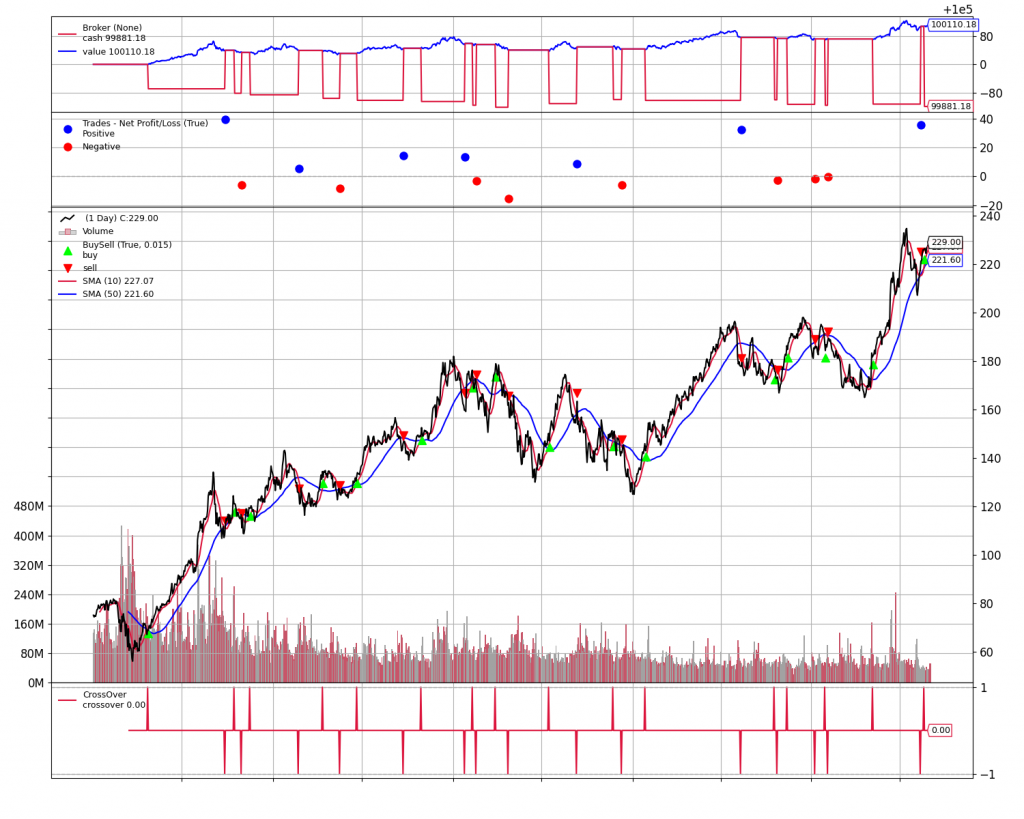
可以得到下面圖形:
整個圖形的解讀有非常多細節可以看,我們這裡先簡單來看:
1.可以在最下面的折線圖看到我們使用的策略在何時買以及何時賣
2.中間層可以看到我們買一次清倉揪竟是賺還是陪
在本節中,我們:
透過回測,我們能夠在進入實際交易之前評估策略的有效性。接下來,我們將探索如何引入AI技術,提升交易策略的智能化水平。
Appendix 1.作業:
透過實踐,您將更深入地理解回測框架的使用方法,為開發高效的交易策略奠定基礎。
注意:Zipline在Colab中可能不易安裝,且支持有限。如果您希望使用Zipline,建議在本地環境或支持的環境中進行。這裡附上 Zipline 的官網
那因為在 Colab 上實在不方便用 Zipline, 筆者在這裡就簡單代一下如何使用, 有興趣的讀者歡迎在自己的 PC 上嘗試看看:
Python 3.5及以下版本上運行最佳。為了避免與現有的Python環境產生衝突,建議建立一個新的虛擬環境。
使用conda建立虛擬環境:
conda create -n zipline_env python=3.5
conda activate zipline_env
使用conda安裝:
conda install -c quantopian zipline
注意:如果遇到安裝問題,可以嘗試以下命令:
conda install -c conda-forge zipline
from zipline.api import order, symbol, record, set_benchmark
from zipline import run_algorithm
import pandas as pd
import pytz
from datetime import datetime
我們一樣採取簡單的均線交叉策略供讀者好與 Backtrader 做比較
示例:簡單的均線交叉策略
def initialize(context):
    context.asset = symbol('AAPL')
    context.short_window = 10
    context.long_window = 50
    context.history_window = context.long_window + 1
    set_benchmark(context.asset)

def handle_data(context, data):
    # 獲取歷史價格數據
    price_history = data.history(context.asset, 'price', bar_count=context.history_window, frequency='1d')

    # 計算移動平均線
    short_mavg = price_history[-context.short_window:].mean()
    long_mavg = price_history[-context.long_window:].mean()

    # 獲取當前持倉
    current_position = context.portfolio.positions[context.asset].amount

    # 產生交易信號
    if short_mavg > long_mavg and current_position == 0:
        order(context.asset, 100)  # 買入100股
    elif short_mavg < long_mavg and current_position > 0:
        order(context.asset, -100)  # 賣出持有的股票

    # 記錄數據
    record(AAPL=data.current(context.asset, 'price'),
           short_mavg=short_mavg,
           long_mavg=long_mavg)
start = pd.Timestamp('2020-01-01', tz='utc')
end = pd.Timestamp('2021-01-01', tz='utc')
results = run_algorithm(start=start,
                        end=end,
                        initialize=initialize,
                        handle_data=handle_data,
                        capital_base=100000,
                        data_frequency='daily',
                        bundle='quantopian-quandl')
Zipline默認使用內置的數據包(bundle),如quantopian-quandl。但我們也可以使用自訂的數據源,例如從Yahoo Finance下載的數據。
yahoo-direct數據包pip install zipline-data-bundles
在命令行中運行:
zipline ingest -b yahoo-direct
results = run_algorithm(start=start,
                        end=end,
                        initialize=initialize,
                        handle_data=handle_data,
                        capital_base=100000,
                        data_frequency='daily',
                        bundle='yahoo-direct')
# 查看資產淨值曲線
import matplotlib.pyplot as plt

plt.figure(figsize=(12,6))
results.portfolio_value.plot()
plt.title('資產淨值曲線')
plt.show()
from pyfolio import create_full_tear_sheet

# 將回測結果轉換為日度收益率
returns = results.portfolio_value.pct_change().dropna()

# 使用PyFolio生成策略報告
create_full_tear_sheet(returns)
注意:需要安裝PyFolio庫
pip install pyfolio
確保時間戳使用UTC時區,否則可能導致數據對齊問題。
start = pd.Timestamp('2020-01-01', tz='utc')
end = pd.Timestamp('2021-01-01', tz='utc')
使用symbol()函數指定交易的資產。例如,symbol('AAPL')。
data_frequency參數可以設定為daily或minute,取決於數據的時間間隔。
如果需要交易多個資產,可以在initialize函數中定義資產列表,並在handle_data中迭代處理。
以下是整合上述步驟的完整代碼:
from zipline.api import order, symbol, record, set_benchmark
from zipline import run_algorithm
import pandas as pd
import pytz
from datetime import datetime
import matplotlib.pyplot as plt

def initialize(context):
    context.asset = symbol('AAPL')
    context.short_window = 10
    context.long_window = 50
    context.history_window = context.long_window + 1
    set_benchmark(context.asset)

def handle_data(context, data):
    # 獲取歷史價格數據
    price_history = data.history(context.asset, 'price', bar_count=context.history_window, frequency='1d')

    # 計算移動平均線
    short_mavg = price_history[-context.short_window:].mean()
    long_mavg = price_history[-context.long_window:].mean()

    # 獲取當前持倉
    current_position = context.portfolio.positions[context.asset].amount

    # 產生交易信號
    if short_mavg > long_mavg and current_position == 0:
        order(context.asset, 100)  # 買入100股
    elif short_mavg < long_mavg and current_position > 0:
        order(context.asset, -100)  # 賣出持有的股票

    # 記錄數據
    record(AAPL=data.current(context.asset, 'price'),
           short_mavg=short_mavg,
           long_mavg=long_mavg)

# 設置回測期間
start = pd.Timestamp('2020-01-01', tz='utc')
end = pd.Timestamp('2021-01-01', tz='utc')

# 執行回測
results = run_algorithm(start=start,
                        end=end,
                        initialize=initialize,
                        handle_data=handle_data,
                        capital_base=100000,
                        data_frequency='daily',
                        bundle='quantopian-quandl')

# 繪製資產淨值曲線
plt.figure(figsize=(12,6))
results.portfolio_value.plot()
plt.title('資產淨值曲線')
plt.show()
Ref:
1.Backtrader官方文件:https://www.backtrader.com/docu/
2.https://www.roelpeters.be/how-to-use-backtrader-plots-in-python-notebooks/
3.https://github.com/quantopian/zipline

版主您好,由於最近在學量化交易,看了您的文章後獲益良多,但在運行您的代碼時發生了以下問題
AttributeError Traceback (most recent call last)
in <cell line: 5>()
3 cerebro.adddata(data_bt)
4 cerebro.broker.setcash(100000.0)
----> 5 results = cerebro.run()
4 frames
/usr/local/lib/python3.10/dist-packages/backtrader/feeds/pandafeed.py in (.0)
210 # Transform names (valid for .ix) into indices (good for .iloc)
211 if self.p.nocase:
--> 212 colnames = [x.lower() for x in self.p.dataname.columns.values]
213 else:
214 colnames = [x for x in self.p.dataname.columns.values]
AttributeError: 'tuple' object has no attribute 'lower'
請問這是正常的嗎,如果不適該如何解決呢,謝謝
jessie1226你好,我判斷了一下應該是 Yfinance 版本的問題,簡單改安裝成下面版本應該就不會有這個問題:
!pip install yfinance==0.2.44
另外因為寫作時程過於緊湊因此這份教程可能有一些遺落,後續時間允許下我也會進行補充跟改寫完整。最後感謝你對本教程的賞識!
好的,謝謝版主的指導!