餅圖(Pie Chart)是一種常用來展示不同類別之間比例分佈的視覺化工具。它能夠以直觀的方式顯示各類別占總體的比例,因此在分析各類別的相對大小時非常有用。今天,我們將講解餅圖的應用情境,並通過 Matplotlib 來繪製餅圖,展示分類的比例分佈。
前幾天有一個叫做plot的檔案,用那一份,然後之前的程式全部都先執行一遍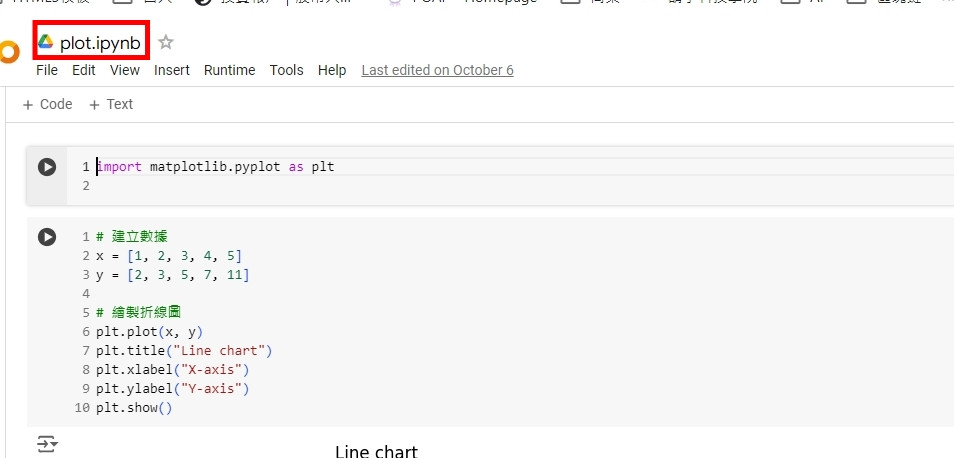
餅圖適合用來展示以下情境的資料:
首先,我們使用 Matplotlib 繪製一個簡單的餅圖,來顯示不同花卉種類在資料集中的比例。
# 計算每個花卉種類的數量
species_counts = iris_df['target'].value_counts()

# 繪製餅圖
plt.pie(species_counts, labels=['Setosa', 'Versicolor', 'Virginica'], autopct='%1.1f%%', startangle=140)
plt.title('Proportion of Different Iris Flower Species in the Dataset')
plt.show()
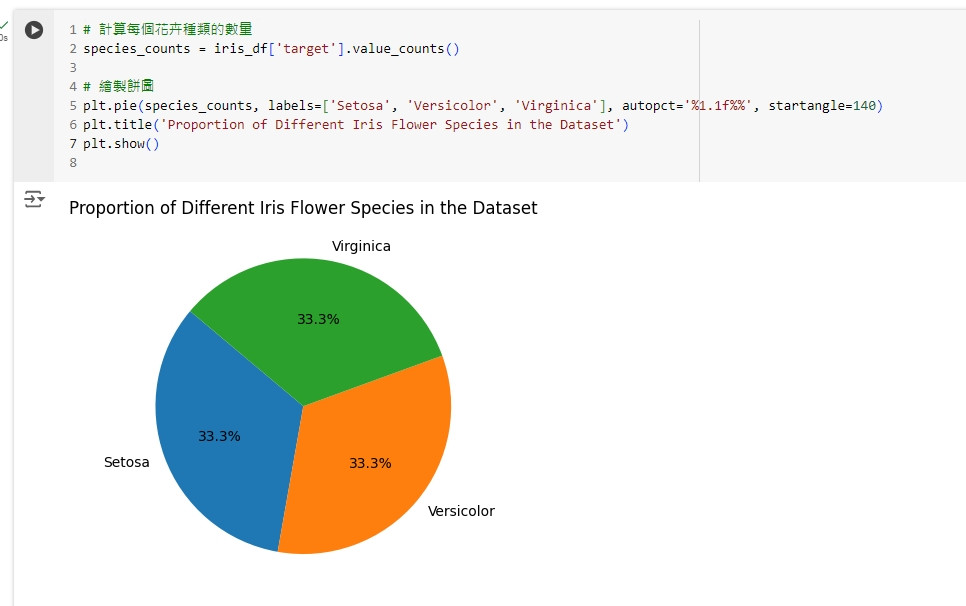
這段程式碼會繪製一個餅圖,顯示 Iris 資料集中三種花卉的比例,並在每個扇形上顯示百分比。
我們可以通過調整餅圖的顏色、分離效果、陰影等屬性來改進餅圖的外觀,使其更加美觀和易於理解。
# 設置顏色與分離效果
colors = ['#ff9999','#66b3ff','#99ff99']
explode = (0.1, 0, 0)  # 將第一塊分離出來

# 繪製改進外觀的餅圖
plt.pie(species_counts, labels=['Setosa', 'Versicolor', 'Virginica'], autopct='%1.1f%%', colors=colors, explode=explode, shadow=True, startangle=140)
plt.title('Proportion of Different Iris Flower Species in the Dataset (Improved)')
plt.show()
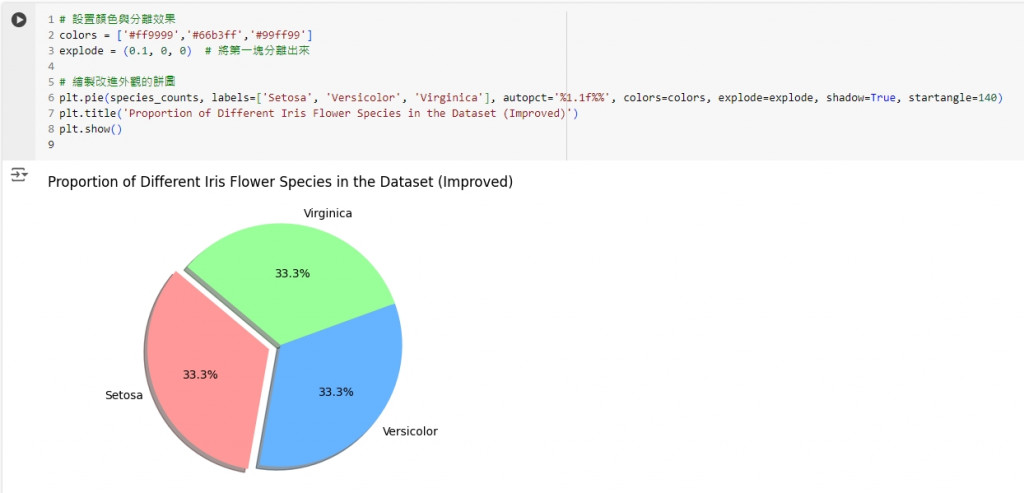
這段程式碼設定了 colors 參數來更改餅圖的顏色,使用 explode 參數將第一個扇形(Setosa)分離出來,並添加了陰影效果(shadow=True)。
我們可以在餅圖中添加圖例和標籤,來更好地描述每個類別的含義。
# 繪製餅圖並添加圖例
plt.pie(species_counts, labels=['Setosa', 'Versicolor', 'Virginica'], autopct='%1.1f%%', colors=colors, explode=explode, shadow=True, startangle=140)
plt.title('Proportion of Different Iris Flower Species in the Dataset')
plt.legend(title="Flower Species", loc="best")
plt.show()
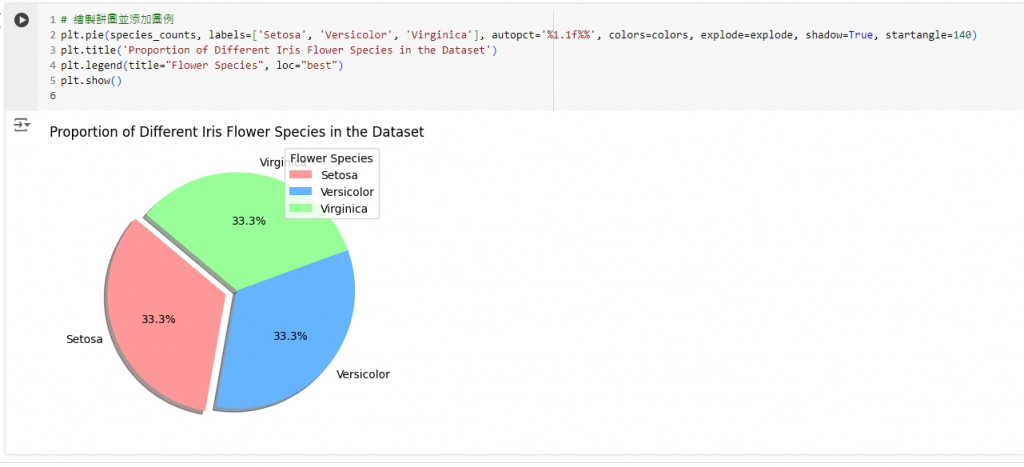
這段程式碼使用 legend() 函數在餅圖中添加了圖例,顯示每個類別的名稱。
有時候我們希望展示多層級的比例資料,可以使用嵌套餅圖(Sub-pie Chart)來表示不同層級之間的關係。
# 子餅圖的數據
group_counts = [50, 50, 50]  # 外圓各類別的樣本數
subgroup_counts = [20, 30, 15, 35, 10, 40]  # 內圓子類別的樣本數

# 設置顏色
colors = ['#ff9999','#66b3ff','#99ff99','#ffcc99','#c2c2f0','#ffb3e6']

# 外圓餅圖
plt.pie(group_counts, radius=1.2, labels=['Group 1', 'Group 2', 'Group 3'], colors=colors[:3], wedgeprops=dict(width=0.3, edgecolor='w'))

# 內圓餅圖
plt.pie(subgroup_counts, radius=1, labels=['A', 'B', 'C', 'D', 'E', 'F'], labeldistance=0.7, colors=colors, wedgeprops=dict(width=0.4, edgecolor='w'))

plt.title('Nested Pie Chart Example')
plt.show()
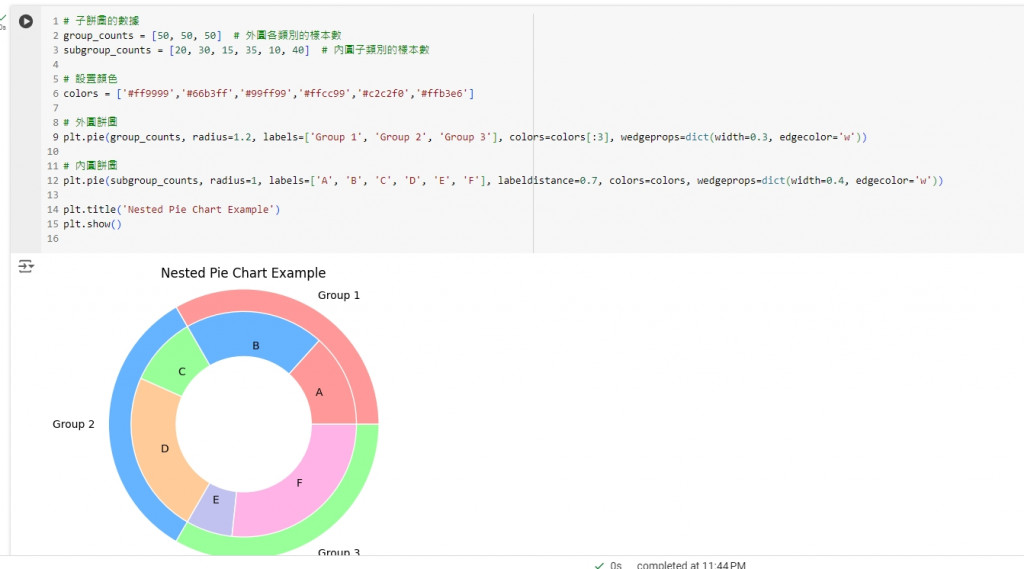
這段程式碼會繪製一個嵌套餅圖,展示不同類別及其子類別的比例分佈。
我們可以直接使用 Pandas 的 plot() 函數來繪製餅圖,方便地展示 DataFrame 中的資料比例。
# 直接使用 DataFrame 繪製餅圖
species_counts_df = species_counts.reset_index()
species_counts_df.columns = ['target', 'count']
species_counts_df.set_index('target', inplace=True)
species_counts_df.plot(kind='pie', y='count', autopct='%1.1f%%', colors=colors, legend=False, title='Proportion of Different Iris Flower Species in the Dataset')
plt.ylabel('')
plt.show()
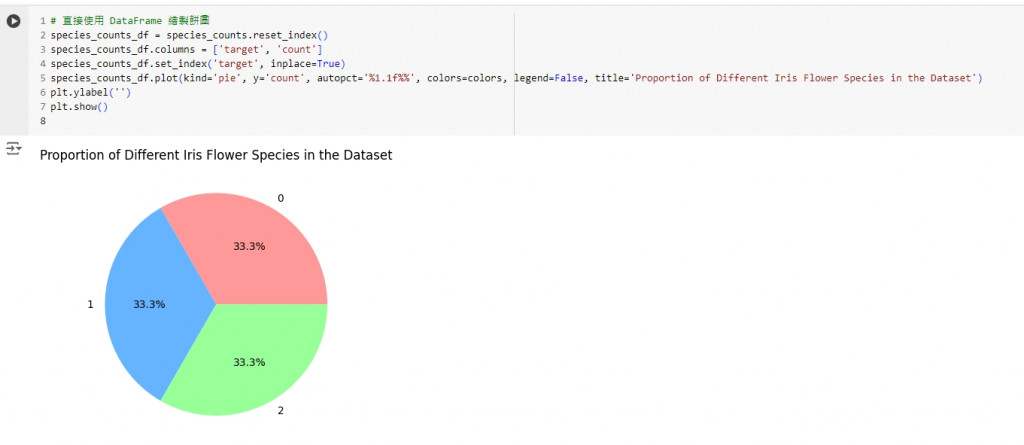
這段程式碼會將 DataFrame 中的資料轉換為餅圖,展示每個花卉種類在資料集中的比例。
今天我們學習了如何使用 Matplotlib 繪製餅圖,包括:
餅圖能夠幫助我們直觀地展示資料的比例分佈,適合用於少量類別的比例比較。接下來,我們將學習如何使用箱型圖來展示資料的分佈情況和檢測異常值。
