使用 NestJS 要如何將相關監控資料提供給 Prometheus 抓取呢?有官方套件可以使用嗎?很遺憾的是,NestJS 官方並 沒有 提供 Prometheus 相關套件讓開發者使用,不過不需要擔心,Prometheus 官方有推薦第三方 Node.js 的 Client 函式庫 - prom-client 讓 Node.js 開發者可以透過它來定義基本的 Metrics 與 Labels,甚至有提供自訂 Metric 的功能,相當方便。
NestJS 社群開發者更是基於 prom-client 包裝了 nestjs-prometheus 的套件讓 NestJS 開發者可以用 NestJS 的風格來串接 Prometheus 的相關設定,大幅提升開發體驗。
透過下方指令安裝 nestjs-prometheus 與其依賴 prom-client:
$ npm install @willsoto/nestjs-prometheus prom-client
使用方式相當簡單,只需要引入 PrometheusModule 並使用其 register 或 registerAsync 靜態方法,就會自動產生 /metrics Endpoint 並提供預設 Metrics。下方是範例程式碼:
import {Module } from '@nestjs/common';
import { PrometheusModule } from '@willsoto/nestjs-prometheus';
// ...

@Module({
  imports: [PrometheusModule.register()],
  // ...
})
export class AppModule {}
啟動應用程式後,透過 Postman 以 GET 方法存取 http://localhost:3000/metrics 就會得到 prom-client 預設提供的 Metrics:
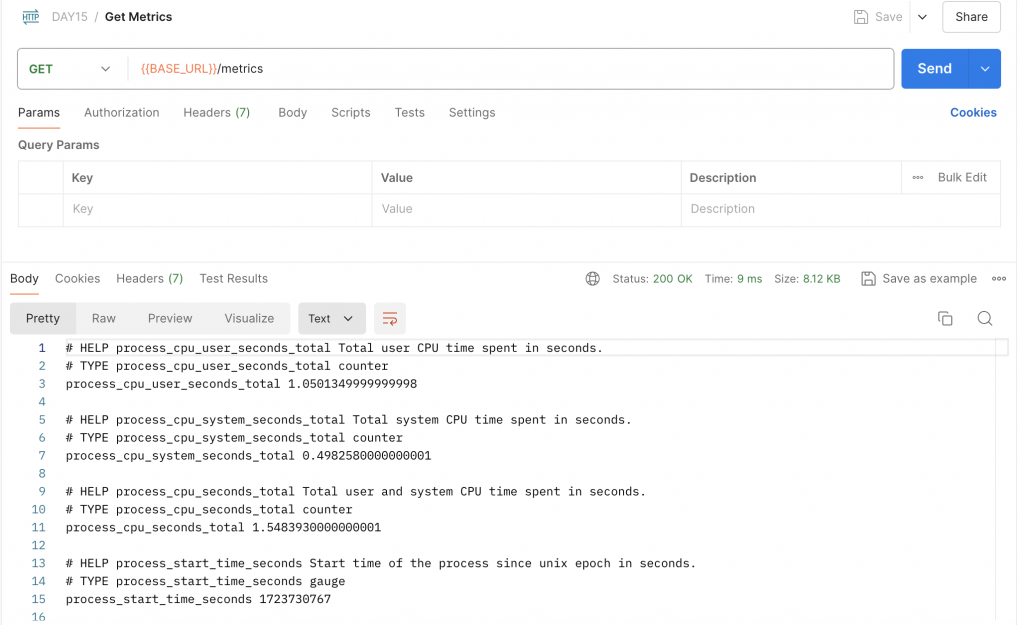
補充:預設 Metrics 提供了部分 Prometheus 定義的 Metric,像是:
process_cpu_seconds_total,除此之外,還提供了 Node.js 獨有的相關 Metrics,像是:nodejs_eventloop_lag_seconds、nodejs_gc_duration_seconds_bucket等,詳細資訊可以參考 官方文件。
如果不想要啟用預設 Metrics,可以透過指定 defaultMetrics 中的 enabled 為 false 來關閉。下方是範例程式碼:
import {Module } from '@nestjs/common';
import { PrometheusModule } from '@willsoto/nestjs-prometheus';
// ...

@Module({
  imports: [
    PrometheusModule.register({
      defaultMetrics: {
        enabled: false,
      },
    })
  ],
  // ...
})
export class AppModule {}
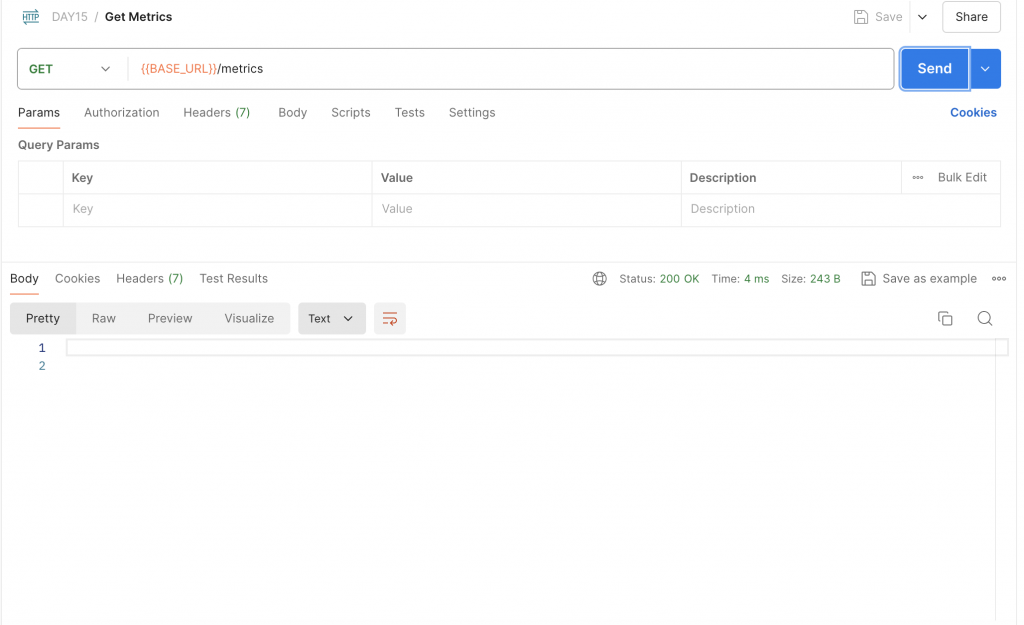
透過 Postman 以 GET 方法存取 http://localhost:3000/metrics 會發現預設 Metrics 的相關資料都不見了:
如果 Prometheus 有特別設定抓取的 Endpoint 不是 /metrics,那可以透過 path 來指定特定的路徑。下方是範例程式碼,將本來的 /metrics 改成 /monitor:
import {Module } from '@nestjs/common';
import { PrometheusModule } from '@willsoto/nestjs-prometheus';
// ...

@Module({
  imports: [
    PrometheusModule.register({
      path: '/monitor',
    })
  ],
  // ...
})
export class AppModule {}
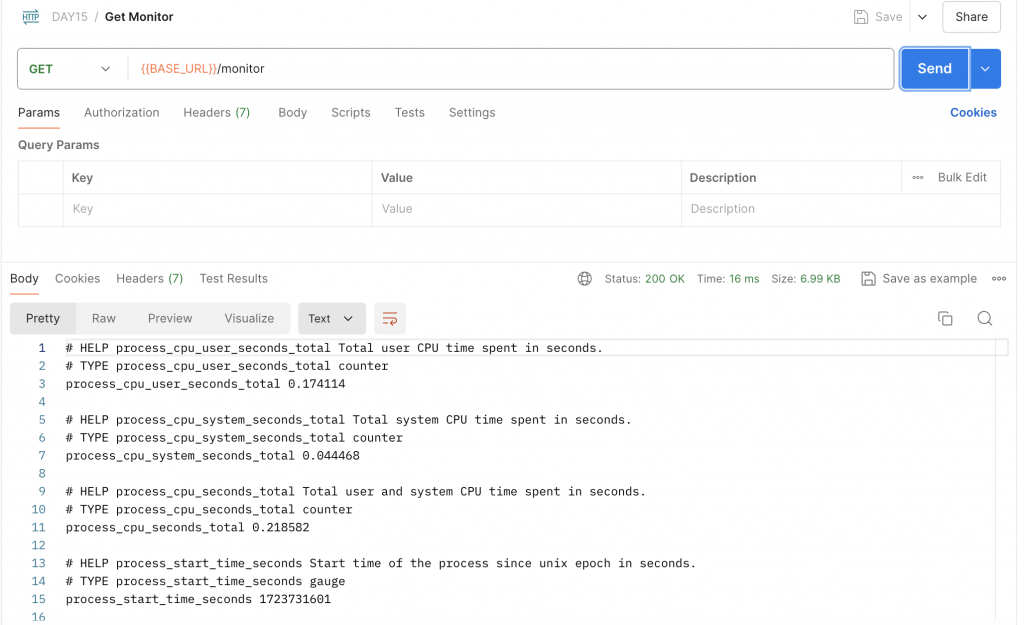
透過 Postman 以 GET 方法存取 http://localhost:3000/monitor 會得到 Metrics 相關資料:
nestjs-prometheus 有提供四個函式讓開發者可以自訂 Metric 並以 Provider 的形式讓 NestJS 管理實例:
makeCounterProvider:用來定義 Counter 類型的 Metric。makeGaugeProvider:用來定義 Gauge 類型的 Metric。makeHistogramProvider:用來定義 Histogram 類型的 Metric。makeSummaryProvider:用來定義 Summary 類型的 Metric。接下來實際做一個自訂 Metric 來收集 HTTP 請求數量,其名稱為 http_requests_total,並會以 HTTP Method、Endpoint Path 與 HTTP Code 作為 Label。下方是範例程式碼,在 providers 使用 makeCounterProvider 函式,並指定 name 為 http_requests_total、help 為 Total number of HTTP requests 以及 labelNames 為 ['method', 'path', 'status']:
import { Module } from '@nestjs/common';
import {
  makeCounterProvider,
  PrometheusModule,
} from '@willsoto/nestjs-prometheus';
// ...

@Module({
  imports: [PrometheusModule.register()],
  providers: [
    // ...
    makeCounterProvider({
      name: 'http_requests_total',
      help: 'Total number of HTTP requests',
      labelNames: ['method', 'path', 'status'],
    }),
  ],
  // ...
})
export class AppModule {}
為了方便我們把每一個 HTTP 請求都記錄下來,需要實作一個 RequestTotalMiddleware 讓所有請求都可以透過此 Middleware 來計數。下方是範例程式碼,透過 @InjectMetric 裝飾器帶入前面定義的 Metric 名稱 http_requests_total 來取得 Counter 實例,並在 use 方法中透過 Counter 的 labels 方法帶入 HTTP Method、Endpoint Path 與 HTTP Code 的值,須依照 labelNames 的順序帶入,最後再透過 inc 方法進行計數:
import { Injectable, NestMiddleware } from '@nestjs/common';
import { NextFunction, Request, Response } from 'express';
import { InjectMetric } from '@willsoto/nestjs-prometheus';
import { Counter } from 'prom-client';

@Injectable()
export class RequestTotalMiddleware implements NestMiddleware {
  constructor(
    @InjectMetric('http_requests_total') private readonly counter: Counter,
  ) {}

  use(req: Request, res: Response, next: NextFunction) {
    this.counter.labels(req.method, req.path, res.statusCode.toString()).inc();
    next();
  }
}
最後,在 AppModule 中套用 RequestTotalMiddleware:
import { MiddlewareConsumer, Module, NestModule } from '@nestjs/common';
import {
  makeCounterProvider,
  PrometheusModule,
} from '@willsoto/nestjs-prometheus';
import { RequestTotalMiddleware } from './request-total.middleware';
// ...

@Module({
  imports: [PrometheusModule.register()],
  providers: [
    // ...
    makeCounterProvider({
      name: 'http_requests_total',
      help: 'Total number of HTTP requests',
      labelNames: ['method', 'path', 'status'],
    }),
  ],
  // ...
})
export class AppModule implements NestModule {
  configure(consumer: MiddlewareConsumer) {
    consumer.apply(RequestTotalMiddleware).forRoutes('*');
  }
}
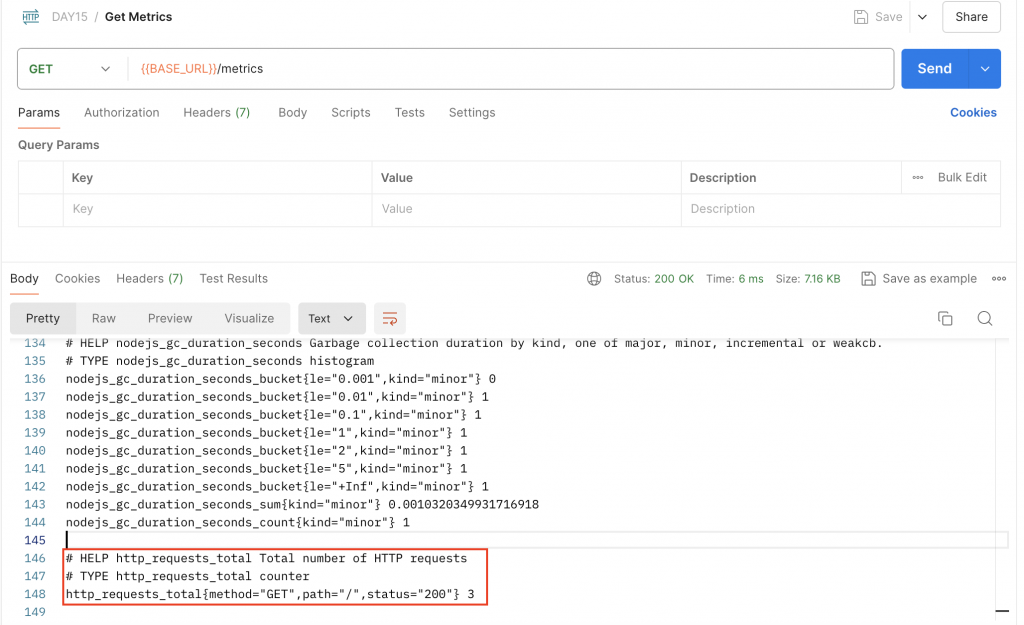
透過 Postman 進行測試,使用 GET 方法存取 http://localhost:3000/metrics 可以找到 http_requests_total 這個 Metric:
現在我們已經了解如何在 NestJS 提供 /metrics Endpoint 讓 Prometheus 抓取資料了,那就來進行整合吧!
首先,修改 prometheus.yml 的內容,新增一個 job_name 為 nestjs-app 的 Job,並指定 target 為 host.docker.internal:3000 讓運行於 Docker 環境的 Prometheus 可以接觸到運行於本機的 NestJS 應用程式:
global:
  scrape_interval: 5s
scrape_configs:
  - job_name: "prometheus"
    static_configs:
      - targets: ["localhost:9090"]
  - job_name: "nestjs-app"
    static_configs:
      - targets: ["host.docker.internal:3000"]
接著,透過下方指令將 Prometheus 架設起來:
$ docker run --name <NAME> -p 9090:9090 -v /<FOLDER>:/etc/prometheus prom/prometheus
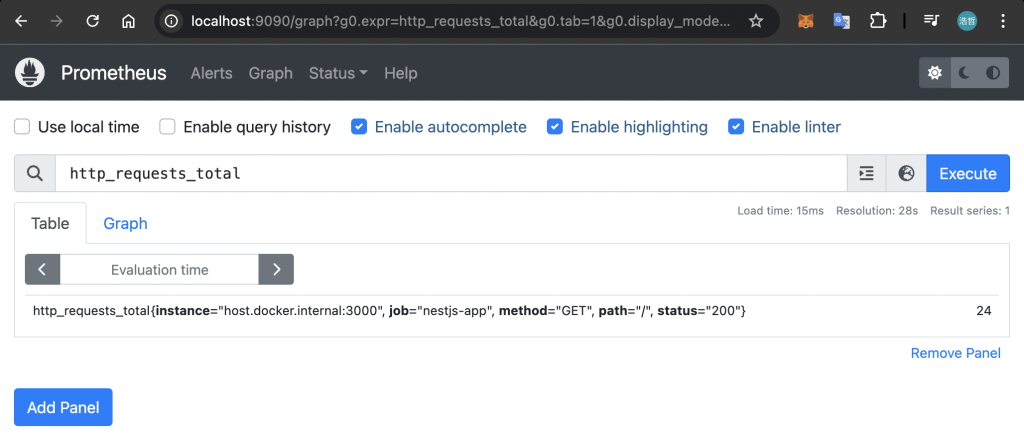
打開瀏覽器並存取 http://localhost:9090,在「Gragh」頁面上方的輸入框輸入 http_requests_total 就可以看到我們自訂的 Metric:
回顧一下今天的重點內容,雖然 NestJS 官方沒有提供 Prometheus 相關的套件給開發者使用,但 Node.js 與 NestJS 社群開發者貢獻了 prom-client 與 nestjs-prometheus 讓一切變得簡單,不僅提供了預設的 Metrics,還讓開發者可以自訂 Metric,甚至運用 nestjs-prometheus 可以讓我們使用 NestJS 的風格來進行開發,提升整體開發體驗!