再過去的幾節中我們進星了基礎的機器學習在股價上的探討,在本節中,我們將深入探討時間序列預測,特別是應用於金融市場的預測。時間序列預測在量化金融中扮演著重要的角色,能夠幫助我們預測未來的價格走勢、收益率等。首先,我們將了解時間序列分析的基本概念,如自相關、差分和穩定性等。接著,我們將學習如何使用ARIMA和Prophet等模型進行時間序列預測,並在實際的股票數據中進行應用。深度學習的部份將於下一節去介紹。今日 Colab
時間序列是一組按時間順序排列的觀測值,通常具有以下特點:
自相關函數(ACF):衡量時間序列與其滯後值之間的相關性。

偏自相關函數(PACF):衡量時間序列與其滯後值之間的純相關性,排除了中間滯後值的影響。
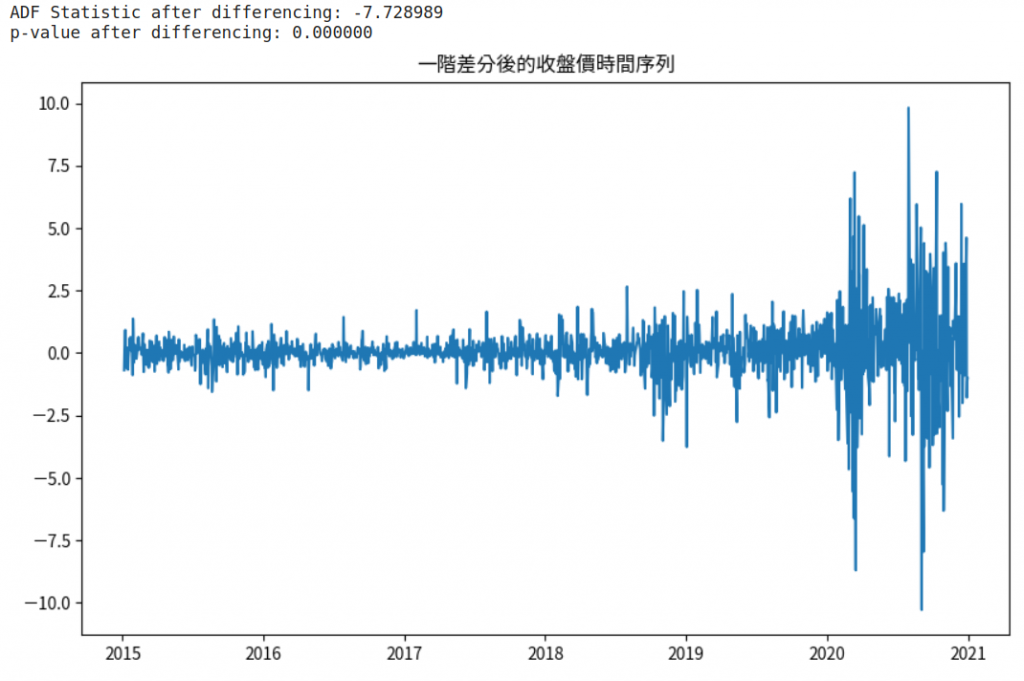
一階差分:用於消除序列的趨勢,使序列平穩。

二階差分:對一階差分後的序列再進行差分,消除更高階的趨勢。
ARIMA模型(自回歸整合移動平均模型)是處理時間序列數據的常用模型。
模型組成:
AR(AutoRegressive,自回歸)部分:使用過去的值來回歸當前值。

I(Integrated,整合)部分:通過差分使非平穩序列變為平穩序列。
MA(Moving Average,移動平均)部分:使用過去的誤差項來回歸當前值。

ARIMA(p, d, q):
檢查平穩性:使用ADF(Augmented Dickey-Fuller)單位根檢驗。
差分處理:對非平穩序列進行差分,直到序列平穩。
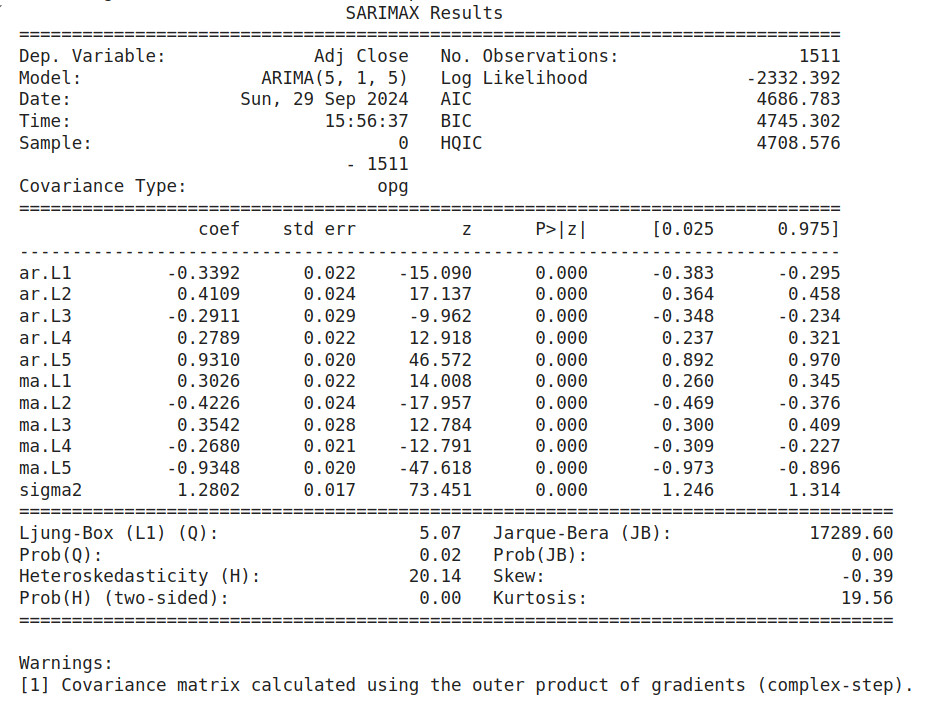
確定模型參數(p, d, q):
模型訓練與預測。
import pandas as pd
import numpy as np
import yfinance as yf
import matplotlib.pyplot as plt

# 獲取股票數據
data = yf.download('AAPL', start='2015-01-01', end='2021-01-01')

# 提取收盤價
close = data['Adj Close']
from statsmodels.tsa.stattools import adfuller

# 原始序列的ADF檢驗
result = adfuller(close)
print('ADF Statistic: %f' % result[0])
print('p-value: %f' % result[1])

# 繪製原始數據
plt.figure(figsize=(10,6))
plt.plot(close)
plt.title('原始收盤價時間序列')
plt.show()
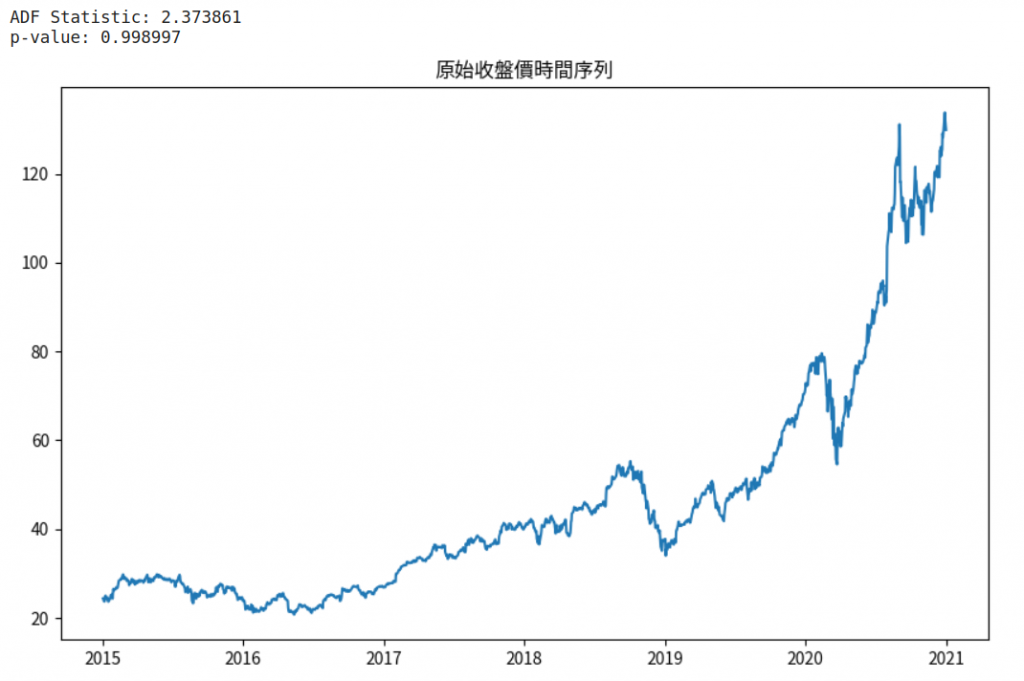
解釋:
# 一階差分
close_diff = close.diff().dropna()

# 差分後序列的ADF檢驗
result = adfuller(close_diff)
print('ADF Statistic after differencing: %f' % result[0])
print('p-value after differencing: %f' % result[1])

# 繪製差分後的數據
plt.figure(figsize=(10,6))
plt.plot(close_diff)
plt.title('一階差分後的收盤價時間序列')
plt.show()
from statsmodels.graphics.tsaplots import plot_acf, plot_pacf

# 繪製ACF和PACF圖
fig, axes = plt.subplots(1,2, figsize=(16,4))
plot_acf(close_diff, lags=20, ax=axes[0])
plot_pacf(close_diff, lags=20, ax=axes[1])
plt.show()

解釋:
from statsmodels.tsa.arima.model import ARIMA

# 設定模型參數 (p, d, q)
p = 5
d = 1
q = 5

# 建立並訓練模型
model = ARIMA(close, order=(p, d, q))
model_fit = model.fit()
print(model_fit.summary())
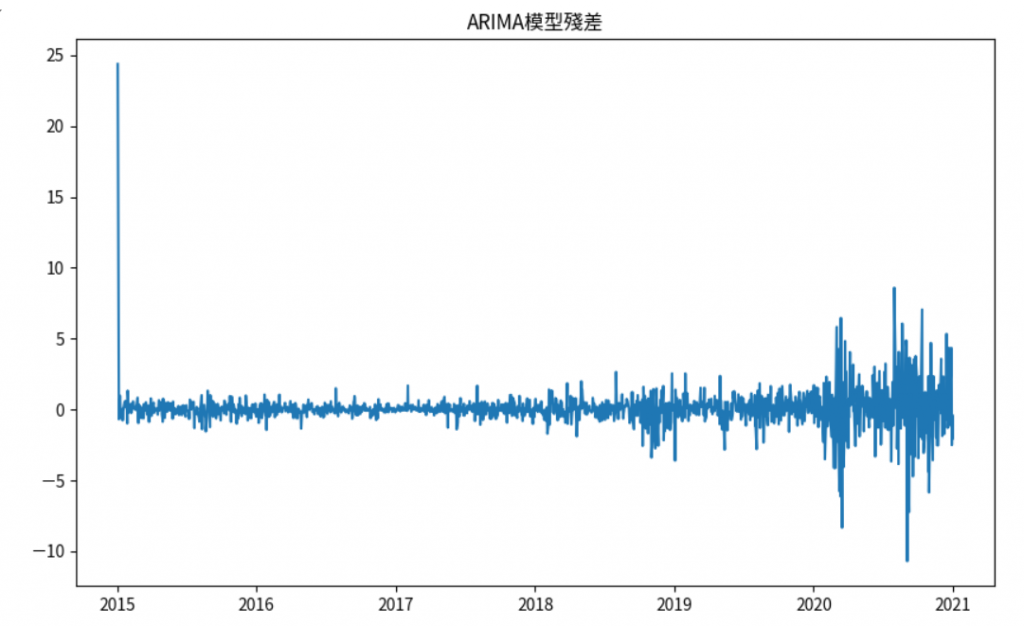
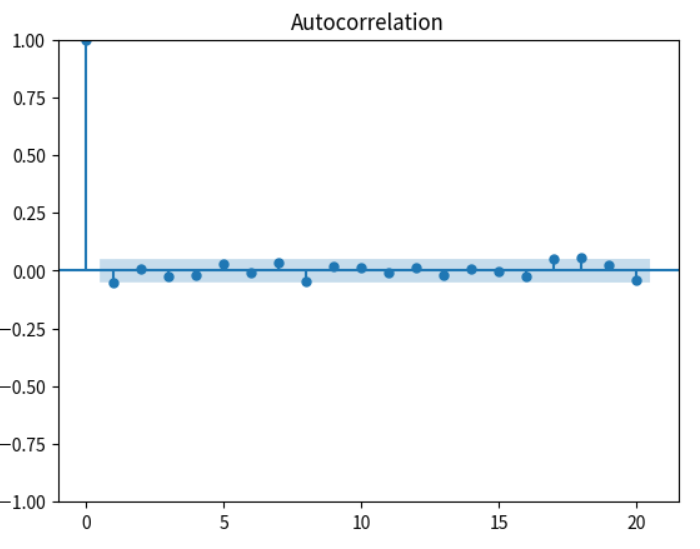
# 檢查殘差是否為白噪聲
residuals = model_fit.resid

# 繪製殘差圖
plt.figure(figsize=(10,6))
plt.plot(residuals)
plt.title('ARIMA模型殘差')
plt.show()

# 殘差的ACF圖
plot_acf(residuals, lags=20)
plt.show()
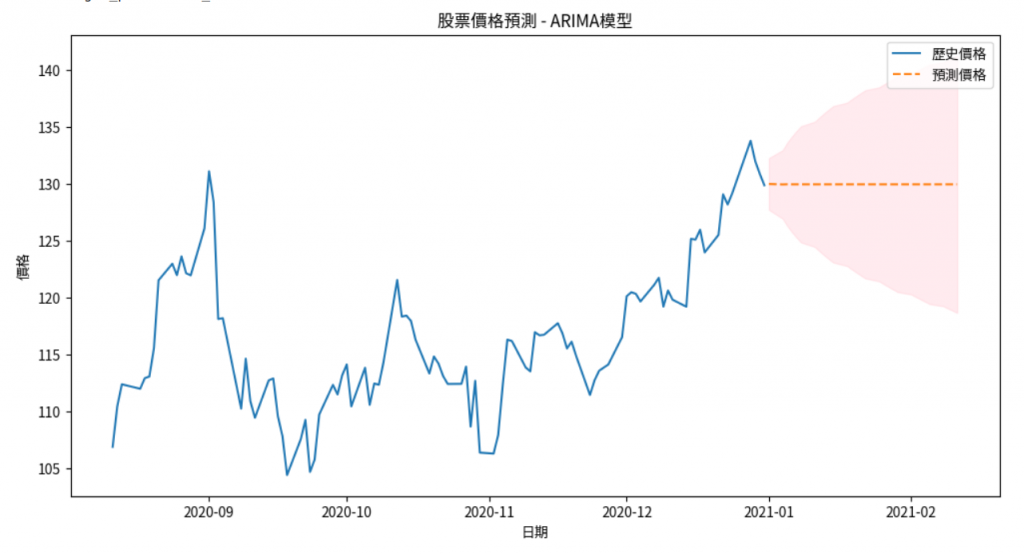
# 預測未来 30 天
forecast_steps = 30
forecast_result = model_fit.get_forecast(steps=forecast_steps)

# 獲取預測均值
forecast_series = forecast_result.predicted_mean

# 獲取信賴區間
confidence_intervals = forecast_result.conf_int()

# 創見預測日期 Index
last_date = close.index[-1]
forecast_dates = pd.date_range(start=last_date + pd.Timedelta(days=1), periods=forecast_steps, freq='B')

# 設置預測的 index
forecast_series.index = forecast_dates
confidence_intervals.index = forecast_dates

# 繪製預測結果
plt.figure(figsize=(12,6))
plt.plot(close[-100:], label='歷史價格')
plt.plot(forecast_series, label='預測價格', linestyle='--')
plt.fill_between(forecast_dates, confidence_intervals.iloc[:, 0], confidence_intervals.iloc[:, 1], color='pink', alpha=0.3)
plt.title('股票價格預測 - ARIMA模型')
plt.xlabel('日期')
plt.ylabel('價格')
plt.legend()
plt.show()
Prophet 是由Facebook開發的開源時間序列預測工具,特點是簡單易用,適合具有明顯趨勢和季節性的時間序列數據。
模型組成:

# 在Colab中安裝Prophet
!pip install prophet

from prophet import Prophet
# 重新組織數據為Prophet需要的格式
df = close.reset_index()
df = df.rename(columns={'Date': 'ds', 'Adj Close': 'y'})
# 建立模型
model = Prophet()

# 訓練模型
model.fit(df)
# 創建未來日期數據框
future = model.make_future_dataframe(periods=30)

# 進行預測
forecast = model.predict(future)

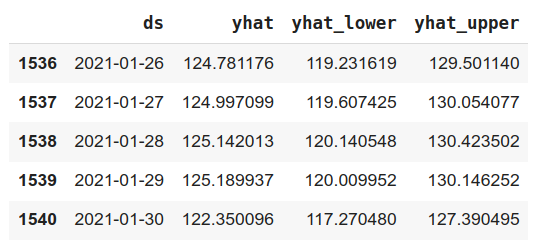
# 查看預測結果
forecast[['ds', 'yhat', 'yhat_lower', 'yhat_upper']].tail()
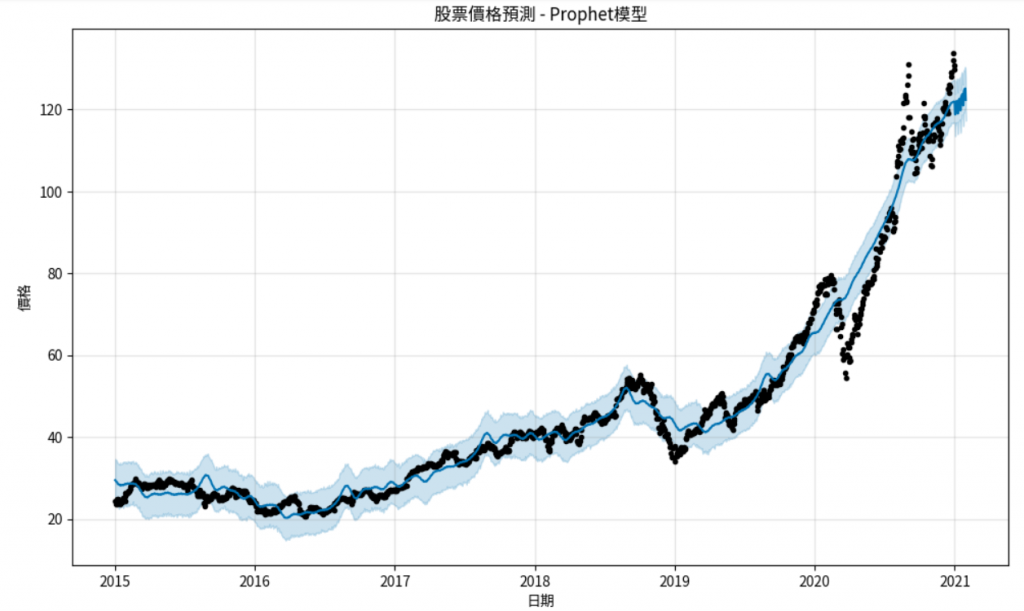
# 繪製預測結果
model.plot(forecast)
plt.title('股票價格預測 - Prophet模型')
plt.xlabel('日期')
plt.ylabel('價格')
plt.show()

# 繪製組成成分圖
model.plot_components(forecast)
plt.show()
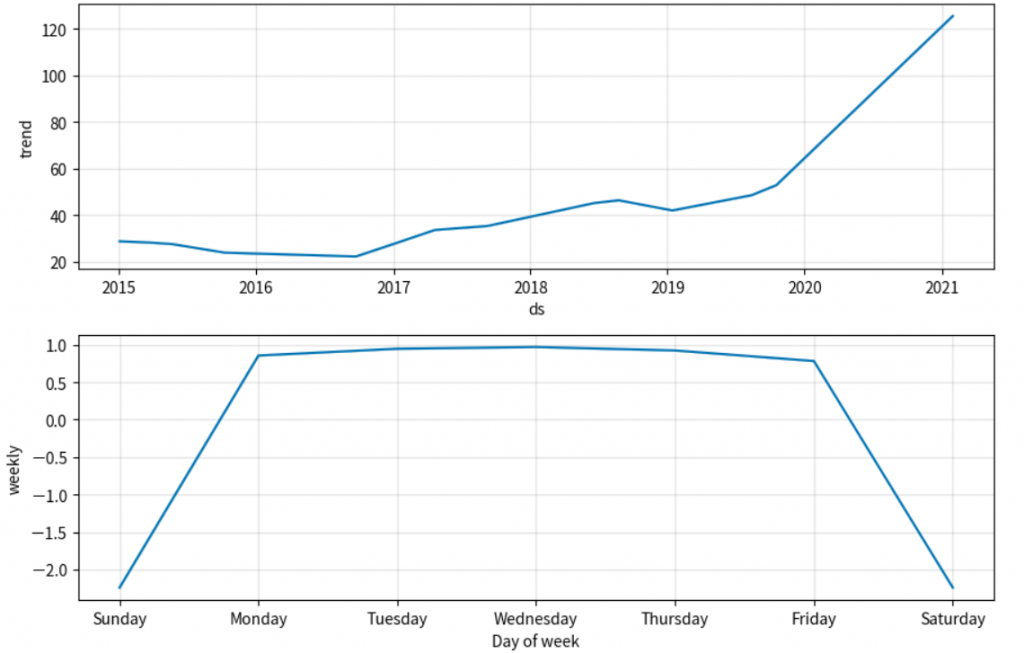
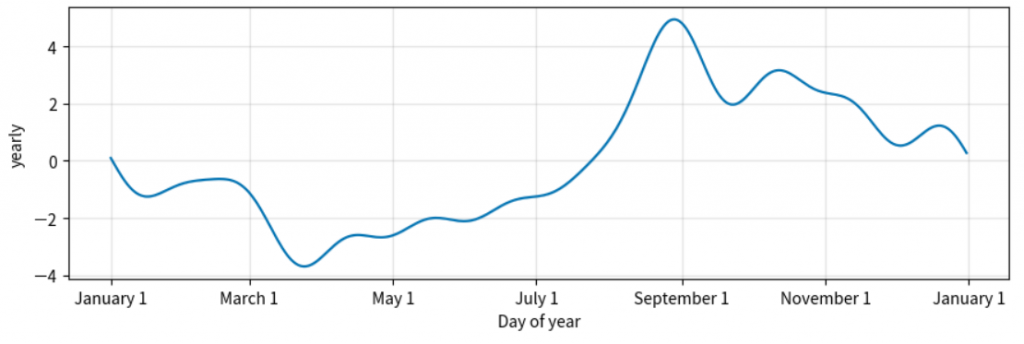
自相關:序列與其滯後值之間的相關性,反映了時間序列的內在結構。
偏自相關:在給定中間滯後值的情況下,序列與其滯後值之間的相關性。
差分:消除序列中的趨勢和季節性,使其平穩。
平穩性:平穩序列的統計特性(均值、方差、自相關)不隨時間變化,是時間序列建模的基本假設。
AIC(Akaike Information Criterion):用於模型選擇,AIC值越小,模型越好。
殘差分析:檢查模型的殘差是否為白噪聲,以驗證模型的適用性。
from sklearn.metrics import mean_squared_error, mean_absolute_error

# 提取實際值和預測值
actual = df['y']
arima_pred = model_fit.predict()  # ARIMA模型的預測
prophet_pred = forecast['yhat']  # Prophet模型的預測

# 計算RMSE
rmse_arima = np.sqrt(mean_squared_error(actual, arima_pred))
rmse_prophet = np.sqrt(mean_squared_error(actual, prophet_pred[:len(actual)]))

print(f'ARIMA模型的RMSE: {rmse_arima:.2f}')
print(f'Prophet模型的RMSE: {rmse_prophet:.2f}')
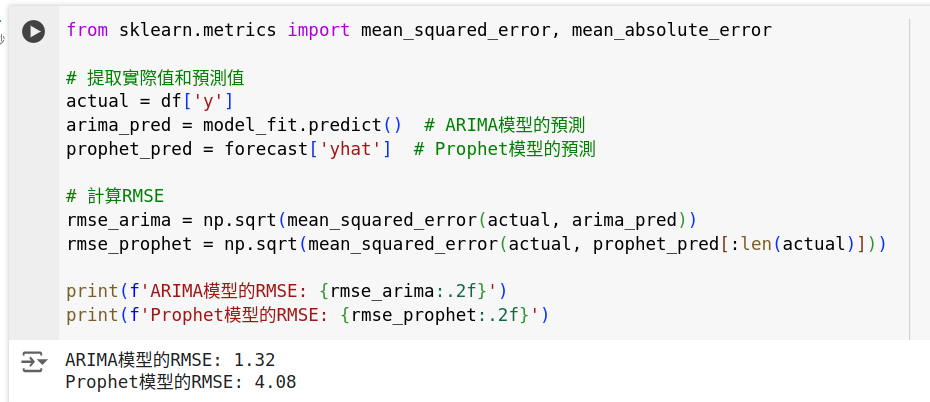
選擇模型:根據評估指標選擇表現較好的模型。
適用性:ARIMA適合於平穩的時間序列,而Prophet對於具有明顯趨勢和季節性的數據更有效。
在本節中,我們:
了解了時間序列分析的基本概念,如自相關、差分和平穩性,為時間序列建模奠定了理論基礎。
學習了ARIMA模型的構建與應用,包括模型參數的確定和模型診斷。
掌握了使用Prophet模型進行預測,並理解了其優勢和適用場景。
比較了兩種模型的性能,了解了如何根據數據特性選擇合適的模型。
時間序列預測在金融分析中具有廣泛的應用,熟練掌握這些模型將有助於提高預測的準確性和可靠性。
作業:
應用ARIMA模型:選擇一支股票或其他時間序列數據,進行差分處理,建立ARIMA模型,並進行未來30天的預測。
應用Prophet模型:使用相同的數據,建立Prophet模型,進行預測,並比較兩種模型的結果。
模型優化:嘗試調整ARIMA模型的參數(p, d, q)或Prophet模型的設定(如添加節假日效應),觀察對預測結果的影響。
透過實踐,您將更深入地理解時間序列預測模型的應用,並能夠在實際的金融分析中選擇合適的模型。
提示:
模型參數選擇:可以使用自動化的方法(如auto_arima)自動選擇最佳的ARIMA模型參數。
!pip install pmdarima
from pmdarima import auto_arima

auto_model = auto_arima(close, seasonal=False, trace=True)
print(auto_model.summary())
處理季節性:如果數據存在季節性,可以使用SARIMA或在Prophet中指定季節性參數。
模型診斷:在模型訓練後,務必進行殘差分析,確保模型的殘差滿足白噪聲的假設。
注意:
數據質量:確保數據的完整性和準確性,避免缺失值和異常值對模型造成影響。
預測不確定性:金融市場具有高度的不確定性,模型預測僅供參考,不能完全依賴。
避免過擬合:在模型構建時,避免使用過多的參數,導致模型過擬合歷史數據而無法泛化。
