安安,今天進入到助教的傅立葉級數分析系列,坐穩囉!
首先先請chatGPT科普一下:
傅立葉級數分析是一種數學方法,用來將週期函數(或信號)分解成不同頻率的簡單正弦波(或餘弦波)的和。這種分析在信號處理、聲音分析、振動分析等領域具有廣泛應用。
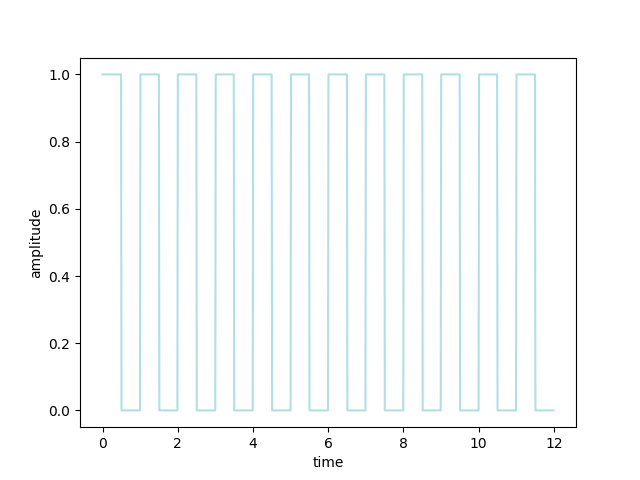
然後方波是一個長得像這樣的波:
繪製程式碼如下:
import numpy as np
import matplotlib.pyplot as plt

def square_wave(T, t, D): #T週期, t時間點, D方波在高波的時間比例
    tinT = np.mod(t, T) #找出t在週期中是哪個階段,mod為餘數函數,取t除以T之後的餘數
    if tinT <= D*T:
        return 1 #若該時間在週期中處於高波時間比例的範圍內,則得出1,1為高波震幅
    else:
        return 0 #不在高波時間比例的範圍內則得出0,0為低頻的震幅。

#製圖精度
N = 1001

#時間的最大值
t_max = 12

#定義週期
T = 1

#定義方波的高波比例
D = 0.5

#時間範圍
t_list = [t_max*i/N for i in range(N)]
#空間範圍
field_list = [square_wave(T, t_list[i], D) for i in range(N)]

plt.plot(t_list, field_list, 'powderblue')
plt.xlabel('time')
plt.ylabel('amplitude')
plt.show()
接下來,我們要用傅立葉級數分析去處理上面這樣的波型:
import numpy as np
import matplotlib.pyplot as plt

def square_wave(T, t, D): #T週期, t時間點, D方波在高波的時間比例
    tinT = np.mod(t, T) #找出t在週期中是哪個階段,mod為餘數函數,取t除以T之後的餘數
    if tinT <= D*T:
        return 1 #若該時間在週期中處於高波時間比例的範圍內,則得出1,1為高波震幅
    else:
        return 0 #不在高波時間比例的範圍內則得出0,0為低頻的震幅。

#製圖精度
N = 1001

#定義週期
T = 10

#時間的最大值
t_max = T

#定義方波的高波比例
D = 0.5

#時間範圍
t_list = [t_max*i/N for i in range(N)]
#空間範圍
field_list = [square_wave(T, t_list[i], D) for i in range(N)]

#兩個函數做內積(兩個函數相乘對空間做積分
#這裡直接將兩個函數的內容定義為陣列array去做對位相乘
def inner_product(list1, list2, dx):
    #先將兩筆函數內容list定義為array型式
    array1 = np.array(list1)
    array2 = np.array(list2)
    product = array1*array2*dx
    return product.sum() #將相乘結果加總

#設定cos傅立葉級數
def Fourier_series_cos(field_list, n):
    cos_list = [np.cos(n*f0*t_list[i]) for i in range(N)]
    return inner_product(cos_list, field_list, T/N)

#設定sin傅立葉級數
def Fourier_series_sin(field_list, n):
    sin_list = [np.sin(n*f0*t_list[i]) for i in range(N)]
    return inner_product(sin_list, field_list, T/N)

#設定基礎頻率
f0 = 2*np.pi/T


#定義傅立葉級數序號,可自行帶入數值,這裏示範為11
n_list = [i for i in range(11)]

#定義傅立葉級數轉換結果cos list
Fourier_series_list_cos = [Fourier_series_cos(field_list, n_list[i]) for i in range(11)]

#定義傅立葉級數轉換結果sin list
Fourier_series_list_sin = [Fourier_series_sin(field_list, n_list[i]) for i in range(11)]


plt.subplot(1,3,1)
plt.plot(t_list, field_list)
plt.xlabel('square wave')
plt.subplot(1,3,2)
plt.scatter(n_list, Fourier_series_list_cos, label = 'cos', color = 'lightskyblue')
plt.legend()
plt.subplot(1,3,3)
plt.scatter(n_list, Fourier_series_list_sin, label = 'sin', color = 'aquamarine')
plt.legend()
plt.show()
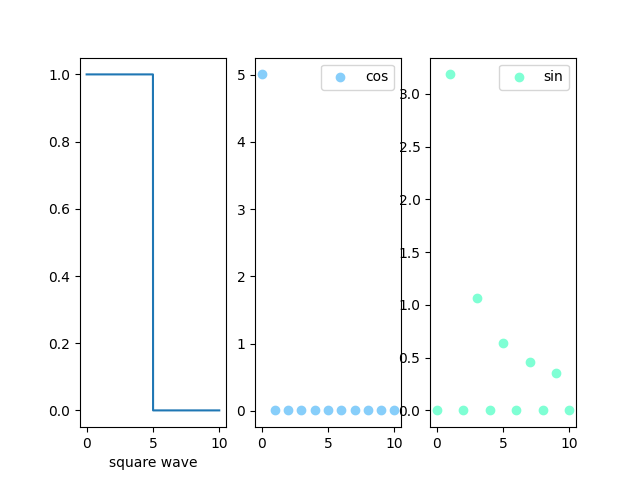
跑出的圖如下:

傅立葉級數轉換可以隨意搭配sin/cos函數,所以這邊兩個都寫了。
以上,今天份量十足,再次感謝助教和AI,我們明天繼續!
