我們在 Day 3 介紹到 Pod,以及 Day 5 介紹到 Affinity Deployment,都有提到 Pod 有狀態,這狀態的轉換將由今天介紹的探針來介紹其機制。
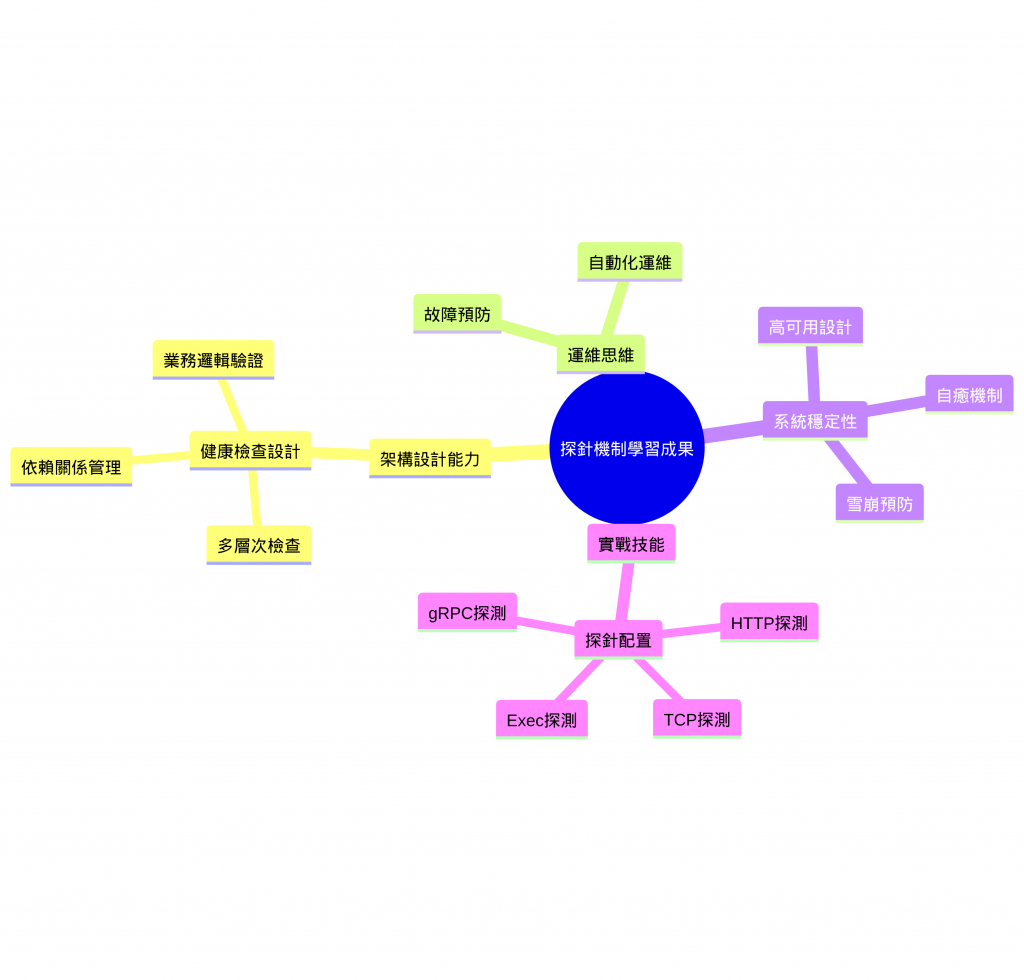
✅ Pod 狀態管理專家
✅ 探針配置大師
✅ 架構設計思維
我們 Day 2 提到過 Pod 是 K8s 中最小的計算單位。而一個 Pod 又能由多個容器組成,相當於每個容器就是一個獨立的應用程式,程式在運行期間也是有可能因為某些原因而 crash 或退出。所以 Pod 會根據所擁有的容器狀態而有不同的 Pod 狀態。
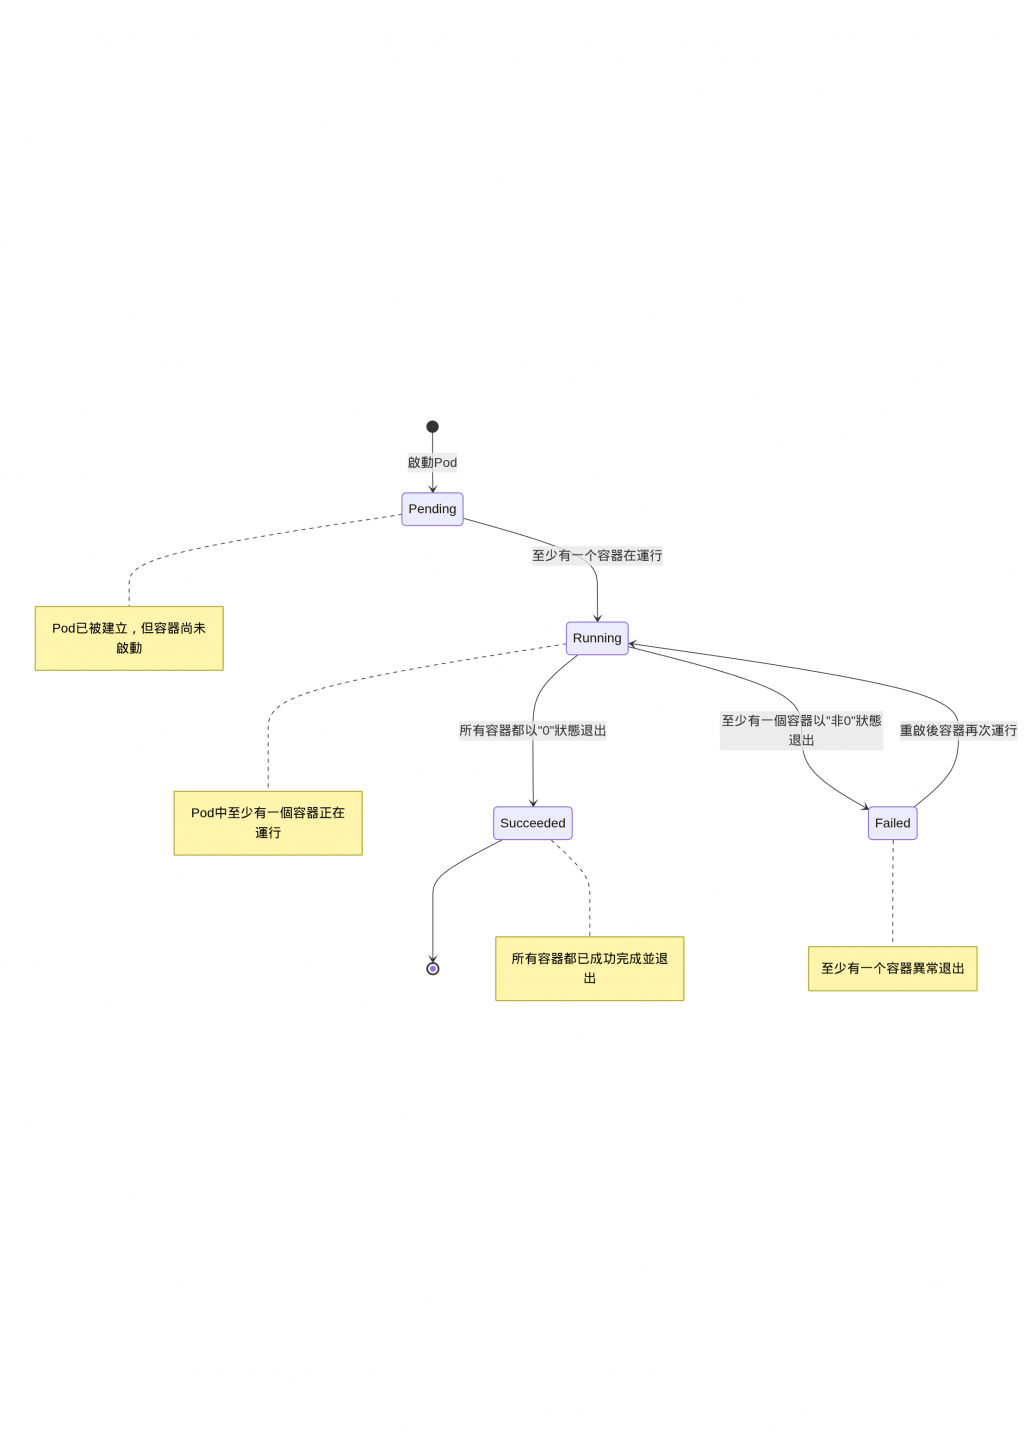
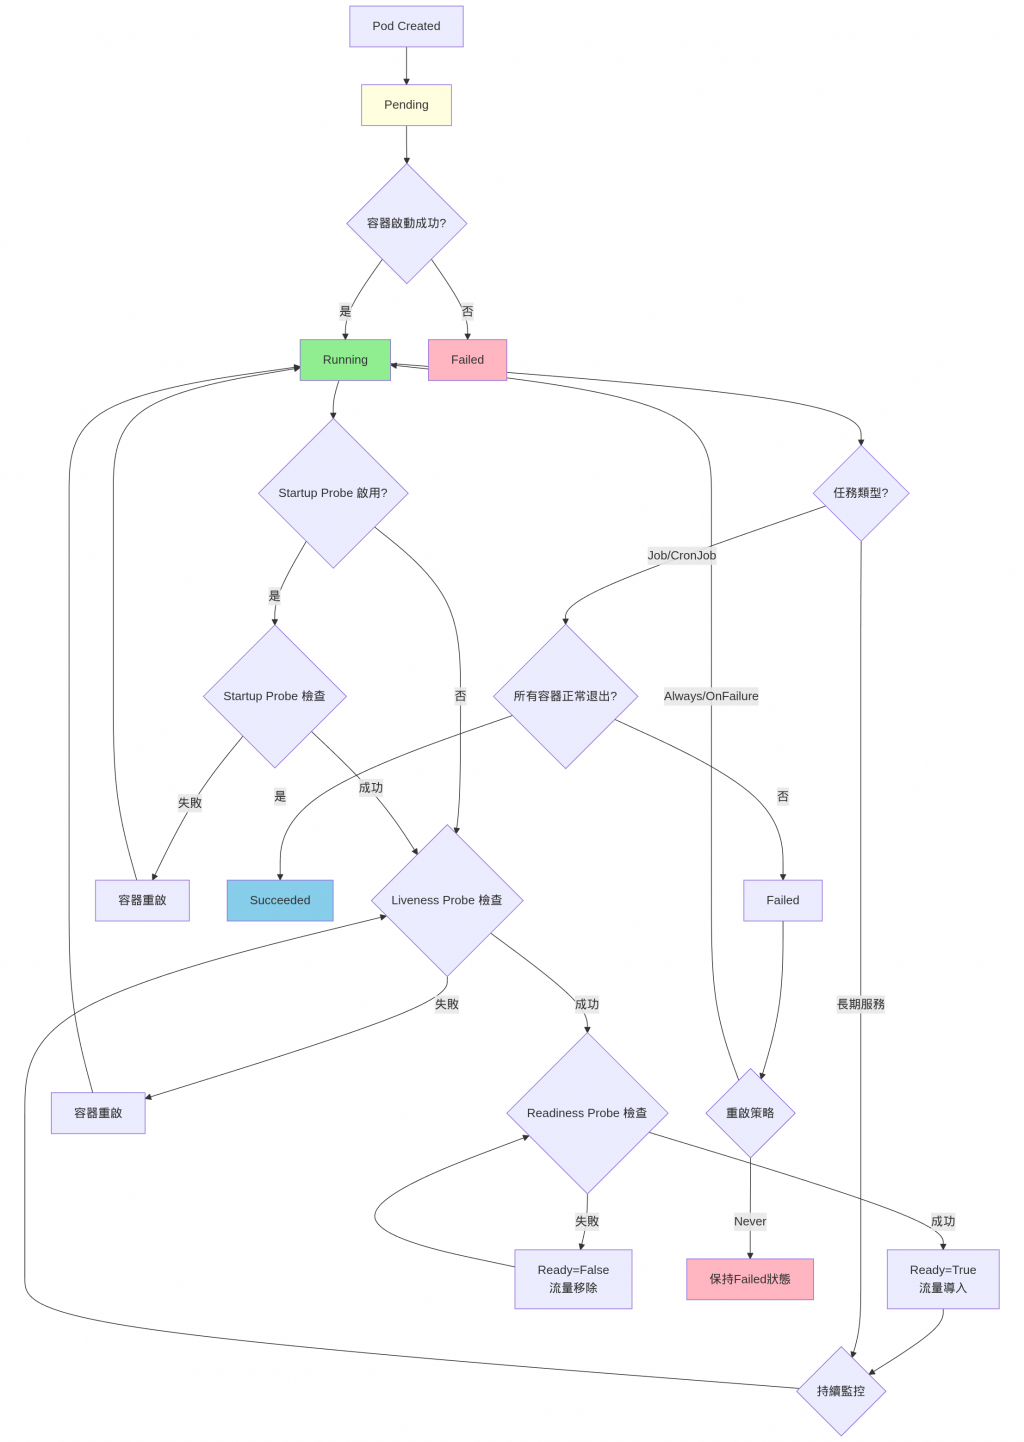
🔄 狀態說明
Pod 剛被建立時的狀態,當 Pod 已經被 k8s 給接受,但有1~多個容器還沒被建立時的狀態。通常可能是還在下載image、或像昨天Affinity講到的在等待調度到合適的節點上,或是資源不夠。
Pod 已經被綁定在節點上了,所有容器也都被建立且至少有一個容器處於啟動中、運作中或是正在重啟中。
所以容器都以exit code
0 狀態退出,代表所有容器都以成功終止。
至少有一個容器以
非0狀態退出。可能是因為程式錯誤crash、資源限制導致的終止。
通常我們會根據服務類型選擇合適的重啟策略,像是 Always(API、DB...)、OnFailure(數據處理任務等)或是 Never(一次性任務、測試等)。
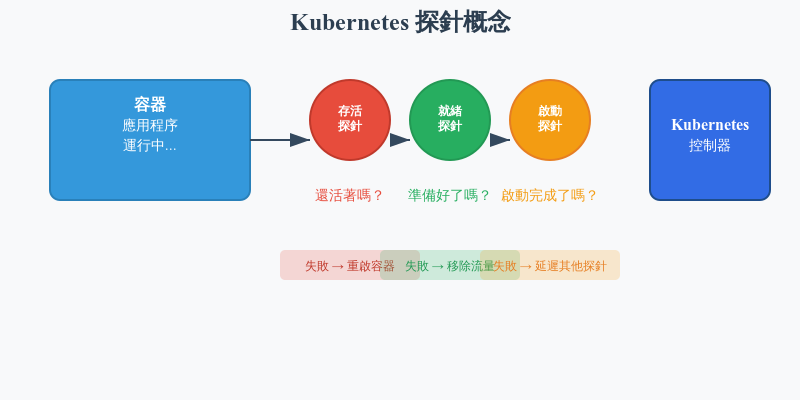
而今天主題 Probe 就是用來管理 Pod 狀態轉換的。
想像你是一位醫生,需要定期檢查病人的健康狀況:
在 Kubernetes 中,探針就像醫生的檢查工具,用來監控容器的健康狀況。
如果你熟悉 Docker Compose,你可能已經使用過 healthcheck 機制:
# docker-compose.yml
version: '3.8'
services:
  web:
    image: nginx:latest
    healthcheck:
      test: ["CMD", "curl", "-f", "http://localhost/health"]
      interval: 30s        # 檢查間隔
      timeout: 10s         # 超時時間
      retries: 3           # 重試次數
      start_period: 40s    # 啟動寬限期
    ports:
      - "80:80"
Kubernetes 的 Probe 機制是 Docker Compose healthcheck 的進階版本
主要差異:
🤔 沒有探針會發生什麼?
想像你開了一家餐廳:
探針就是為了發現這些問題而存在的!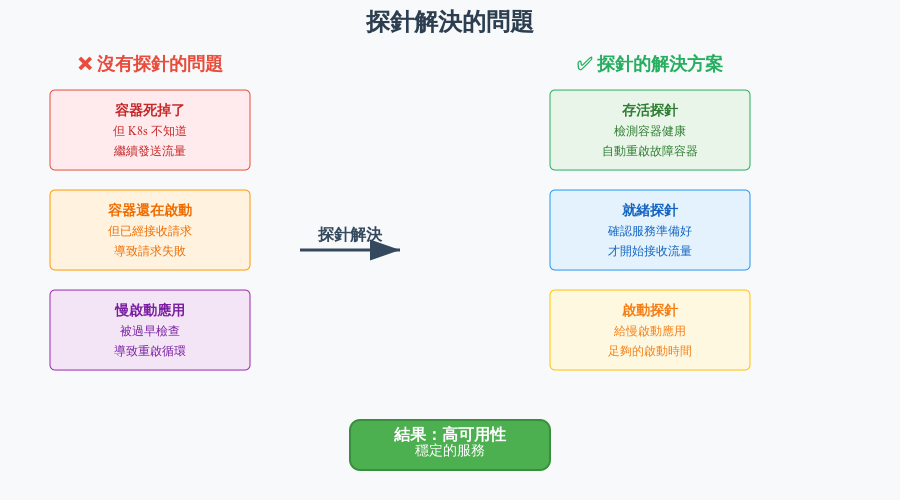
為了監控這些容器狀態的穩定性,當容器發生問題時能進行重啟等機制,就需要這些 probe 機制來監控。
作用:檢查容器是否還活著
比喻:就像檢查心跳,如果沒有心跳就需要急救(重啟)
作用:檢查容器是否準備好接收流量
比喻:就像餐廳開門前檢查廚師是否準備好,準備好了才讓客人進來
作用:給慢啟動的應用足夠時間
比喻:就像給新員工一個適應期,不要在第一天就要求他達到老員工的標準
# probe_demo.yaml
apiVersion: v1
kind: Pod
metadata:
  name: web-app
spec:
  restartPolicy: Always
  containers:
  - name: nginx
    image: nginx:1.20
    ports:
    - containerPort: 80

    startupProbe:
      httpGet:
        path: /
        port: 80
      initialDelaySeconds: 10
      periodSeconds: 5
      failureThreshold: 6  # 30秒內啟動

    livenessProbe:
      httpGet:
        path: /
        port: 80
      periodSeconds: 30
      failureThreshold: 3

    readinessProbe:
      httpGet:
        path: /
        port: 80
      periodSeconds: 10
      failureThreshold: 3
> kubectl apply -f probe_demo.yaml && kubectl get pod web-app -o jsonpath='Phase:{.status.phase} | Ready:{.status.conditions[?(@.type=="Ready")].status} | ContainersReady:{.status.conditions[?(@.type=="ContainersReady")].status} | RestartCount:{.status.containerStatuses[0].restartCount}{"\n"}' -w

pod/web-app created
Phase:Pending | Ready:False | ContainersReady:False | RestartCount:0
Phase:Running | Ready:False | ContainersReady:False | RestartCount:0
Phase:Running | Ready:False | ContainersReady:False | RestartCount:0
Phase:Running | Ready:True | ContainersReady:True | RestartCount:0
每個階段的詳細說明︰
階段 1:PendingPhase:Pending | Ready:False | ContainersReady:False | RestartCount:0
Pod 剛被創建,正在等待調度,可能在下載鏡像或等待節點資源
階段 2:Running (未就緒)Phase:Running | Ready:False | ContainersReady:False | RestartCount:0
容器已啟動,但還沒通過健康檢查
根據你的配置:initialDelaySeconds: 10, periodSeconds: 5,這時 startupProbe 正在工作。
階段 3:Running (就緒)Phase:Running | Ready:True | ContainersReady:True | RestartCount:0
startupProbe 成功! readinessProbe 也通過了
Pod 現在可以接收流量。
kind-probe-failure-demo.yaml
# kind-probe-failure-demo.yaml
apiVersion: v1
kind: Pod
metadata:
  name: failure-demo
spec:
  containers:
  - name: app
    image: nginx:1.20
    ports:
    - containerPort: 80

    # 故意配置會失敗的探針
    livenessProbe:
      httpGet:
        path: /nonexistent-endpoint
        port: 80
      initialDelaySeconds: 5
      periodSeconds: 3  # 每 3 秒檢查一次
      failureThreshold: 2  # 失敗 2 次就重啟
      timeoutSeconds: 1

    readinessProbe:
      httpGet:
        path: /
        port: 80
      initialDelaySeconds: 2
      periodSeconds: 2
      timeoutSeconds: 1
> kubectl apply -f kind-probe-failure-demo.yaml && kubectl get pod failure-demo -o jsonpath='Phase:{.status.phase} | Ready:{.status.conditions[?(@.type=="Ready")].status} | ContainersReady:{.status.conditions[?(@.type=="ContainersReady")].status} | RestartCount:{.status.containerStatuses[0].restartCount}{"\n"}' -w

pod/failure-demo created
Phase:Pending | Ready:False | ContainersReady:False | RestartCount:0
Phase:Running | Ready:False | ContainersReady:False | RestartCount:0
Phase:Running | Ready:True | ContainersReady:True | RestartCount:0
Phase:Running | Ready:False | ContainersReady:False | RestartCount:1
Phase:Running | Ready:True | ContainersReady:True | RestartCount:1
Phase:Running | Ready:False | ContainersReady:False | RestartCount:2
Phase:Running | Ready:True | ContainersReady:True | RestartCount:2
每個階段的詳細說明︰
階段 1:PendingPhase:Pending | Ready:False | ContainersReady:False | RestartCount:0
階段 2:Running (啟動檢查期)Phase:Running | Ready:False | ContainersReady:False | RestartCount:0
容器已啟動,但正在進行啟動檢查
階段3:Running (服務就緒)Phase:Running | Ready:True | ContainersReady:True | RestartCount:0
第一次失敗循環 (RestartCount: 0→1)
T+5秒:Liveness Probe 開始
T+8秒:第二次 Liveness 檢查
T+8秒:觸發容器重啟Phase:Running | Ready:False | ContainersReady:False | RestartCount:1
此時 Kubernetes 殺死容器並重新啟動
Pod 狀態變為 Ready:False
T+10秒:容器重啟完成Phase:Running | Ready:True | ContainersReady:True | RestartCount:1
Kubernetes 提供了四種不同的探測方式來檢查容器的健康狀態,每種方式適用於不同的應用場景。
📋 基本原理
向容器的指定端口和路徑發送 HTTP GET 請求,根據 HTTP status code 判斷健康狀態,200-399 視為成功,其他視為失敗。
  containers:
  - name: web-server
    image: nginx:1.20
    ports:
    - containerPort: 80

    # HTTP GET 存活探針
    livenessProbe:
      httpGet:
        path: /health           # health check 端點
        port: 80
        scheme: HTTP           # 協議 (HTTP/HTTPS)
        httpHeaders:           # 可選:自定義 request header
        - name: Custom-Header
          value: probe-request
      initialDelaySeconds: 30  # 初始延遲,單位是 second,初始值是 0 秒
      periodSeconds: 10        # 檢查間隔,單位是 second,初始值是 10 秒
      timeoutSeconds: 5        # 超時時間,單位是 second,初始值是 1 秒
      failureThreshold: 3      # 探針失敗的重試次數,初始值是3次
      successThreshold: 1      # 探針檢測成功的最小連續成功次數,初始值是1次

    # HTTP GET 就緒探針
    readinessProbe:
      httpGet:
        path: /ready
        port: 80
        scheme: HTTP
      initialDelaySeconds: 5
      periodSeconds: 5
      timeoutSeconds: 3
      failureThreshold: 3
🎯 適用場景
📋 基本原理
嘗試與容器的指定port 建立 TCP 連接,連接成功視為健康,連接失敗視為不健康。
不發送任何payload,只檢查port可達性。
  containers:
  - name: database
    image: postgres:13
    env:
    - name: POSTGRES_PASSWORD
      value: "password"
    ports:
    - containerPort: 5432

    # TCP Socket 存活探針
    livenessProbe:
      tcpSocket:
        port: 5432             # check port
      initialDelaySeconds: 30
      periodSeconds: 10
      timeoutSeconds: 5
      failureThreshold: 3

    # TCP Socket 就緒探針
    readinessProbe:
      tcpSocket:
        port: 5432
      initialDelaySeconds: 5
      periodSeconds: 5
      timeoutSeconds: 3
      failureThreshold: 3
🎯 適用場景
📋 基本原理
使用 gRPC Health Checking Protocol。這是專門為 gRPC 服務設計的探測方式
    # gRPC 存活探針
    livenessProbe:
      grpc:
        port: 9090             # gRPC 服務端口
        service: myservice     # 可選:指定服務名稱
      initialDelaySeconds: 30
      periodSeconds: 10
      timeoutSeconds: 5
      failureThreshold: 3
📋 基本原理
在容器內執行指定的命令。
命令exit code為 0 視為成功,非 0 視為失敗。是最靈活的探測方式,可以執行複雜的健康檢查邏輯
    # Exec 存活探針
    livenessProbe:
      exec:
        command:
        - /bin/sh
        - -c
        - "ps aux | grep -v grep | grep my-app || exit 1"
      initialDelaySeconds: 30
      periodSeconds: 15
      timeoutSeconds: 10
      failureThreshold: 3

    # Exec 就緒探針 - 檢查文件是否存在
    readinessProbe:
      exec:
        command:
        - /bin/sh
        - -c
        - "test -f /tmp/ready"
      initialDelaySeconds: 5
      periodSeconds: 5
      timeoutSeconds: 5
      failureThreshold: 3
或是能夠檢查 process 是否運作
exec:
  command:
  - /bin/sh
  - -c
  - "pgrep -f my-application > /dev/null"  # 檢查 porcess 是否運行
PostgreSQL
exec:
  command:
  - /bin/sh
  - -c
  - "pg_isready -h localhost -p 5432"  # PostgreSQL 連接檢查
🎯 適用場景
通過合理配置 probe,我們可以實現精確的容器健康監控,確保應用的高可用性和穩定性。Probe 機制是 K8s 自癒能力的核心組件,掌握它們的使用方法對於運維 K8s cluster 至關重要。
自癒 vs 雪崩:適當的探針配置是自癒,錯誤的配置可能導致雪崩效應。
自癒效果:

🏗️ 架構設計能力提升
從寫程式到設計系統的思維轉變
以前我們寫健康檢查可能就是簡單回個 "OK",但現在你會開始思考:這個服務真的健康嗎?資料庫連得上嗎?Redis 還活著嗎?外部 API 有回應嗎?這就是從功能導向轉向可靠性導向的思維。
學會分層思考服務健康
你開始理解不同的健康狀態有不同的意義。就像人的健康一樣,有基本的生命體徵(還活著嗎?),有工作能力(能正常工作嗎?),還有學習適應期(新人需要時間熟悉環境)。這讓你在設計 API 時會考慮得更周全。
🔧 運維思維的培養
從寫完就丟給運維,到主動承擔系統穩定性
以前可能覺得程式跑起來就好了,出問題再說。但現在你會主動思考:我的服務掛了怎麼辦?怎麼讓它自己恢復?怎麼在出問題前就發現異常?這種預防性思維讓你寫出來的程式更加健壯。
開始關心使用者體驗
你會意識到服務重啟時使用者會受到影響,所以開始設計優雅的啟動和關閉流程。就像餐廳換廚師時,不能讓客人感受到服務中斷一樣。
🚀 微服務架構的深度理解
理解服務之間的複雜關係
單體應用時,所有東西都在一起,掛了就一起掛。但微服務時代,你開始理解服務間的依賴關係就像生態系統一樣複雜。A 服務依賴 B 服務,B 服務依賴資料庫,任何一環出問題都可能影響整個系統。
學會控制流量和部署風險
你開始理解為什麼不能一次性把所有服務都更新,而是要漸進式地切換流量。就像開車換道一樣,要先確認旁邊車道安全,再慢慢切過去。