前面幾天分別練習了抓資料、清理、存檔、視覺化。
今天要把這些步驟串在一起,做一個完整的小專案,練習從資料取得到分析的完整過程。
驗收自己的學習成果
學習很多單一技能後,我們需要確認自己是不是真的會把這些技能串在一起用。整合專案就是一個機會,讓我們練習把分開學的知識合併,看看自己是不是學會了。
模擬實際學習過程
在學習過程中,通常不只是做單一項目,像是只寫程式或只畫圖表,而是要學會一個完整的流程:
先取得或收集資料
(像是從網站下載資料、或老師給的資料)
接著整理或處理資料
(把錯誤資料改正、格式調整成容易使用的樣子)
然後分析資料,找出其中重要的訊息或趨勢
最後用圖表或簡單報告,把結果表達出來,方便自己或其他人理解
養成流程思考習慣
做整合專案會讓我們習慣一步一步做,每個步驟都會有成果,像是資料整理好、分析出結論、畫出圖表。
這樣的好處是:
當出現問題時,我們可以清楚知道問題出在哪個步驟,方便找出錯誤並修正。
讓整個工作過程更有條理,也更容易掌握進度。
今天要來挑戰一個小專案,把前面幾天學過的技能整合起來。
我會先從 API 抓到一份待辦任務清單和使用者名單,接著進行清理,把資料整理成乾淨、變成好用的版本。
整理好的資料不只會存成 JSON 和 CSV,還會做一個彙總表,算出每個使用者完成了多少任務,以及完成率是多少。最後,我會用圖表把結果視覺化,像是畫出每個使用者完成任務數量的長條圖,讓資訊呈現更加清楚。
簡單來說,今天就是把抓資料、清理、存檔、視覺化、檢查結果 串成一個小小的資料處理流程。
全部流程都完成後,可以看到一份乾淨的資料表格,還有一張任務完成狀況的圖表。
步驟 0:準備環境
pip install requests matplotlib
安裝 requests 函式庫,用來從網路上抓取資料的工具。
透過它,我們可以用簡單的程式碼向網頁或 API 發出請求,拿回想要的資料。
這是做資料分析常用的第一步,因為資料很多時候是網路上拿來的。
pip install pandas openpyxl
安裝 matplotlib 函式庫,用來畫圖表。
它能幫助我們把資料變成長條圖、折線圖等視覺化圖形,方便理解和展示分析結果。
步驟 1:抓資料
從網站的 /todos 取得任務清單,這裡面的資料會有使用者ID(userId)、任務名稱(title)跟是否完成(completed)。
從 /users 取得使用者資料,裡面有使用者的 ID 和名字,方便後面配對任務和使用者。
import os, csv, json, argparse
from collections import defaultdict
from datetime import datetime
import requests

API_TODOS = "https://jsonplaceholder.typicode.com/todos"
API_USERS = "https://jsonplaceholder.typicode.com/users"
OUT_DIR = "output"
def stamp():
    return datetime.now().strftime("%Y%m%d_%H%M%S")

def ensure_dir(path):
    os.makedirs(path, exist_ok=True)

def save_json(data, path):
    ensure_dir(os.path.dirname(path))
    with open(path, "w", encoding="utf-8") as f:
        json.dump(data, f, ensure_ascii=False, indent=2)

def save_csv(rows, path, fieldnames):
    ensure_dir(os.path.dirname(path))
    # 用 utf-8-sig 讓 Windows Excel 開啟不亂碼
    with open(path, "w", newline="", encoding="utf-8-sig") as f:
        w = csv.DictWriter(f, fieldnames=fieldnames)
        w.writeheader()
        w.writerows(rows)
def fetch_json(url, timeout=15):
    r = requests.get(url, timeout=timeout)
    r.raise_for_status()
    return r.json()
步驟 2:清理資料
把任務中重要的欄位 userId 和 title 有缺少的資料刪掉,因為這些是關鍵資訊。
把 completed 欄位的資料通通轉成「是」或「否」(布林值),讓格式統一更好用。
除去有重複的任務 ID,避免重複計算。
def coerce_bool(v):
    if isinstance(v, bool):
        return v
    if isinstance(v, str):
        return v.strip().lower() in ("true", "1", "yes", "y")
    if isinstance(v, (int, float)):
        return v != 0
    return False

def clean_todos(raw_todos):
    # 輸入原始 /todos,輸出清理後 todos
    seen = set()
    cleaned = []
    for t in raw_todos:
        tid = t.get("id")
        user_id = t.get("userId")
        title = (t.get("title") or "").strip()
        completed = coerce_bool(t.get("completed"))

        # 關鍵欄位缺失就丟棄
        if user_id is None or title == "":
            continue

        # 去重(以 id)
        if tid in seen:
            continue
        seen.add(tid)

        cleaned.append({
            "id": tid,
            "user_id": int(user_id),
            "title": title,
            "completed": completed,
        })
    return cleaned
步驟 3:存檔
把原始的 JSON 原封不動保存下來,方便以後查證或回頭對照。
把清理過的資料存成 CSV,這種格式可以用 Excel 或其他分析軟體打開,操作比較方便。
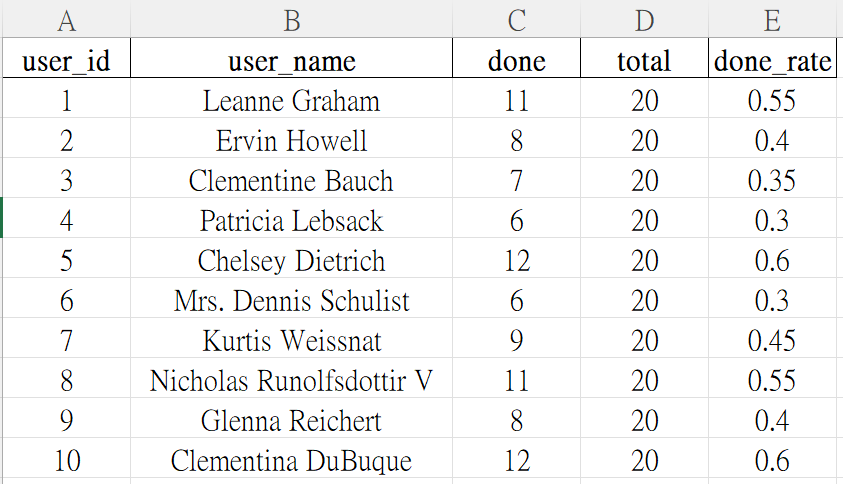
製作一張匯總表,統計每個使用者完成任務的數量、總任務數量,還有完成率。
def users_map_by_id(raw_users):
    # 建立一張使用者ID對應使用者姓名的對照表。
    # 如果某位使用者沒有名字,就用 "User {ID}" 當預設名稱。
    mp = {}
    for u in raw_users:
        uid = u.get("id")
        name = (u.get("name") or "").strip()
        if uid is not None:
            mp[int(uid)] = name or f"User {uid}"
    return mp

# 彙總
def summarize_by_user(clean_todos, id2name):
    # 輸出每位使用者的完成數/總數/完成率
    total = defaultdict(int)
    done = defaultdict(int)
    for t in clean_todos:
        uid = t["user_id"]
        total[uid] += 1
        if t["completed"]:
            done[uid] += 1

    rows = []
    for uid in sorted(total):
        d = done[uid]
        n = total[uid]
        rate = d / n if n else 0.0
        rows.append({
            "user_id": uid,
            "user_name": id2name.get(uid, f"User {uid}"),
            "done": d,
            "total": n,
            "done_rate": round(rate, 4),
        })
    return rows
步驟 4:視覺化
def plot_bar(count_rows, out_path, value_key="done", title="Completed Todos by User"):
    # 畫各使用者的長條圖
    ensure_dir(os.path.dirname(out_path))
    try:
        import matplotlib.pyplot as plt
    except ImportError:
        print("未安裝 matplotlib,略過繪圖。請先:pip install matplotlib")
        return

    xs = [str(r["user_id"]) for r in count_rows]
    ys = [r[value_key] for r in count_rows]

    plt.figure(figsize=(10, 5))
    plt.bar(xs, ys)
    plt.xlabel("User ID")
    plt.ylabel(value_key)
    plt.title(title)
    plt.tight_layout()
    plt.savefig(out_path, dpi=150)
    plt.close()
    print(f"已輸出圖檔:{out_path}")
步驟 5:輸出並檢查
輸出 Excel
def save_xlsx(rows, path):
    try:
        import pandas as pd
    except ImportError:
        print("未安裝 pandas/openpyxl,略過 Excel。若需要:pip install pandas openpyxl")
        return
    ensure_dir(os.path.dirname(path))
    pd.DataFrame(rows).to_excel(path, index=False)
    print(f"已輸出 Excel:{path}")
主流程
def main():
    ap = argparse.ArgumentParser(description="Day20:API → 清理 → 存檔 → 視覺化")
    ap.add_argument("--outdir", default=OUT_DIR, help="輸出資料夾(預設 output)")
    ap.add_argument("--timeout", type=float, default=15.0, help="API 逾時秒數(預設 15)")
    ap.add_argument("--excel", action="store_true", help="同時輸出 Excel")
    args = ap.parse_args()

    ts = stamp()
    raw_dir = os.path.join(args.outdir, "raw")
    clean_dir = os.path.join(args.outdir, "clean")
    summary_dir = os.path.join(args.outdir, "summary")
    fig_dir = os.path.join(args.outdir, "figs")
    try:
        raw_todos = fetch_json(API_TODOS, timeout=args.timeout)
        raw_users = fetch_json(API_USERS, timeout=args.timeout)
    except requests.exceptions.RequestException as e:
        print("API 失敗:", e)
        return

    # 存原始
    save_json(raw_todos, os.path.join(raw_dir, f"todos_{ts}.json"))
    save_json(raw_users, os.path.join(raw_dir, f"users_{ts}.json"))
    print(f"抓到 todos:{len(raw_todos)} 筆;users:{len(raw_users)} 筆")
    todos = clean_todos(raw_todos)
    print(f"清理後 todos:{len(todos)} 筆")

    # 存清理後 CSV(逐筆待辦)
    todo_fields = ["id", "user_id", "title", "completed"]
    clean_csv_path = os.path.join(clean_dir, f"todos_clean_{ts}.csv")
    save_csv(todos, clean_csv_path, todo_fields)
    id2name = users_map_by_id(raw_users)
    summary_rows = summarize_by_user(todos, id2name)
    summary_fields = ["user_id", "user_name", "done", "total", "done_rate"]
    summary_csv_path = os.path.join(summary_dir, f"todo_summary_{ts}.csv")
    save_csv(summary_rows, summary_csv_path, summary_fields)

    if args.excel:
        save_xlsx(summary_rows, os.path.join(summary_dir, f"todo_summary_{ts}.xlsx"))
    plot_bar(summary_rows, os.path.join(fig_dir, f"done_by_user_{ts}.png"),
             value_key="done", title="Completed Todos by User")
    plot_bar(summary_rows, os.path.join(fig_dir, f"done_rate_by_user_{ts}.png"),
             value_key="done_rate", title="Completion Rate by User")

    print("流程結束,輸出在:", os.path.abspath(args.outdir))
if __name__ == "__main__":
    main()
執行結果:
抓到 todos:200 筆;users:10 筆
清理後 todos:200 筆
已輸出 Excel:output\summary\todo_summary_20251002_083844.xlsx
已輸出圖檔:output\figs\done_by_user_20251002_083844.png
已輸出圖檔:output\figs\done_rate_by_user_20251002_083844.png
流程結束,輸出在: C:\Users\Alice\day20\output
確認電腦裡有一個叫做 output 的資料夾,裡面有:
raw/:放原始的 JSON 檔案
clean/:放清理過後的 CSV 檔案
summary/:放每個使用者的統計資料表
figs/:放長條圖的圖片檔 PNG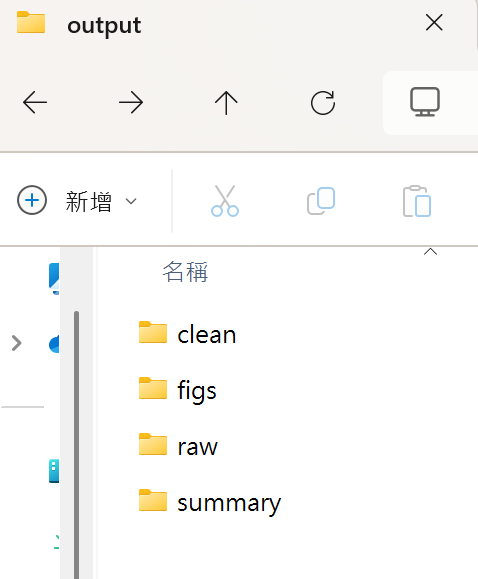
輸出的 Excel 工作表
長條圖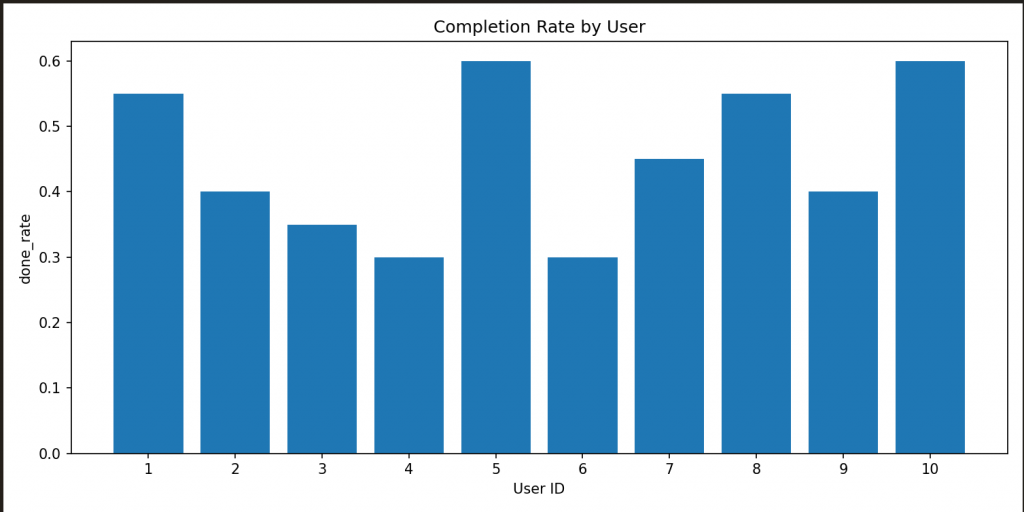
今天我把 API 到分析的流程完整跑了一遍。首先是去抓 /todos 和 /users,接著把資料整理乾淨,再存成 CSV,最後還畫出每個使用者的完成數跟完成率的長條圖。
做完之後我有兩個體會,第一個是原始資料一定要先留一份,不然之後要回頭檢查或重跑會變得很麻煩。
第二個則是清理規則要先想清楚,比如哪些欄位算關鍵、布林值要怎麼統一、重複要怎麼判斷。不然每次算出來的結果可能都不一樣。
這個小專案讓我把前面學到的抓 API、資料清理、存檔跟視覺化串起來,終於有種真的把資料從頭到尾分析一次的完整感,很有成就感。

