因為我會有多條策略需要監控(每一個策略各獨立一個container),每條策略會定期把最新的監控數據寫到Upstash裡面,然後儀錶板網頁透過讀取Upstash會知道有多少條策略,並把這些數據都秀出來;只要在Notion中遷入儀表板的網址,就能從Notion的某個筆記頁中直接監控所有策略的最新狀況: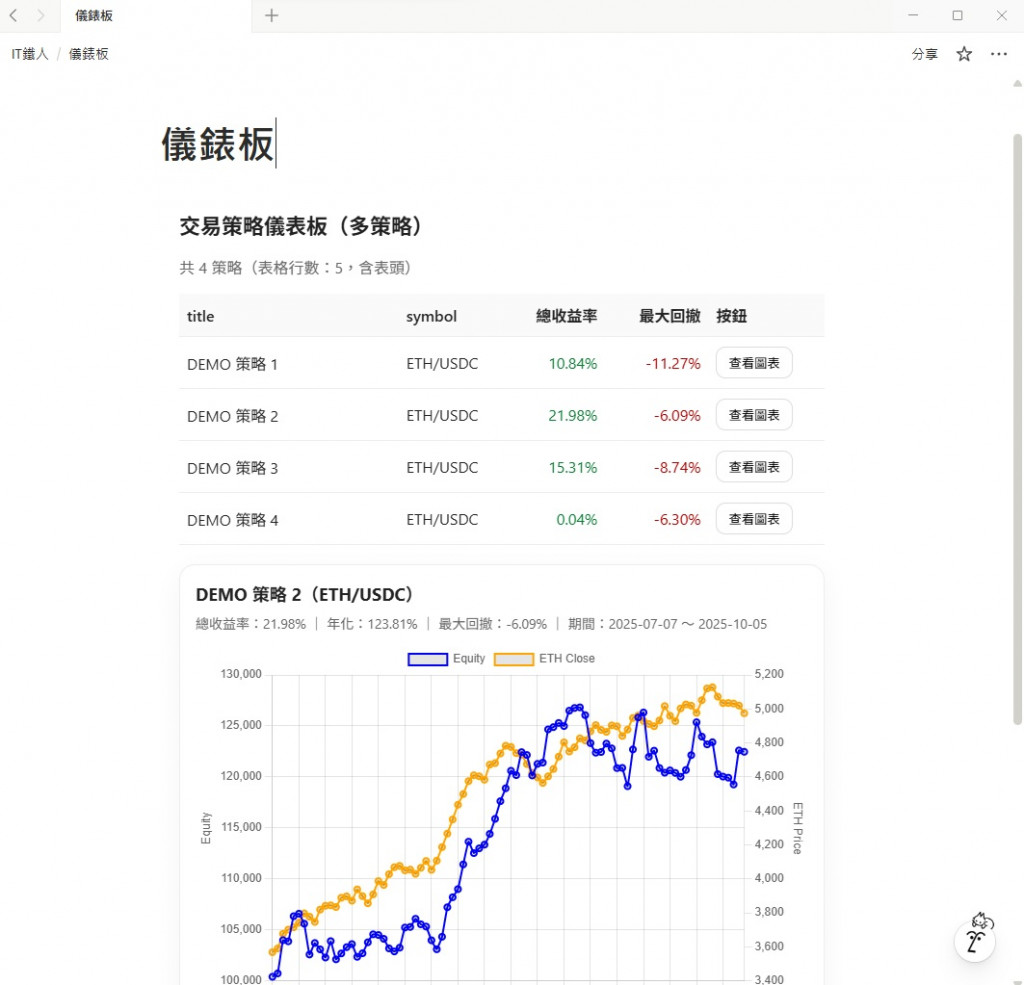
下面寫一個假的python程式模擬把數據推上Upstash:
import requests, json, random
from datetime import datetime, timedelta
import pytz

# ====== Upstash REST 設定(請填入你自己的)======
REST_URL = ""        # 例如:https://us1-rest-sly-xxx.upstash.io
WRITE_TOKEN = ""     # Write Token(千萬不要放到前端)
headers = {"Authorization": f"Bearer {WRITE_TOKEN}"}

# ====== 參數 ======
DAYS = 90
BASE_EQUITY = 100_000.0
BASE_PRICE = 3500.0
tz = pytz.timezone("Asia/Taipei")

def upstash_set(key: str, obj):
    url = f"{REST_URL}/set/{key}"
    res = requests.post(url, data=json.dumps(obj, ensure_ascii=False), headers=headers, timeout=10)
    res.raise_for_status()
    return res.json()

def compute_drawdown(equity_list):
    """回傳最大回撤(負值),e.g. -0.0833"""
    peak = equity_list[0]
    max_dd = 0.0
    for x in equity_list:
        if x > peak: peak = x
        dd = (x / peak) - 1.0
        if dd < max_dd:
            max_dd = dd
    return round(max_dd, 6)

def annualized_return(total_return, days):
    if days <= 0:
        return 0.0
    return round((1.0 + total_return) ** (365.0 / days) - 1.0, 6)

def gen_one_strategy(idx: int, now_tpe: datetime):
    rng = random.Random(20251005 + idx)  # 固定 seed(你可改成 time-based)
    equity = BASE_EQUITY
    price = BASE_PRICE

    series = []
    equities = []

    for i in range(DAYS):
        d = (now_tpe - timedelta(days=DAYS - 1 - i)).date().isoformat()
        # 製造不同策略風格(均值 & 波動不同)
        mu = rng.uniform(0.0001, 0.0012)
        sigma = rng.uniform(0.007, 0.018)
        daily_ret = rng.gauss(mu, sigma)
        equity *= (1.0 + daily_ret)
        equities.append(equity)

        price += rng.uniform(-60, 90)
        if price < 100: price = 100.0

        series.append({
            "date": d,
            "equity": round(equity, 2),
            "eth_close": round(price, 2),
        })

    total_ret = round((equity / equities[0]) - 1.0, 6)
    mdd = compute_drawdown(equities)
    ar = annualized_return(total_ret, DAYS)

    started_at = (now_tpe - timedelta(days=DAYS)).replace(second=0, microsecond=0).isoformat(timespec="minutes")
    updated_at = now_tpe.replace(second=0, microsecond=0).isoformat(timespec="minutes")

    board = {
        "id": f"demo-{idx}",
        "name": f"DEMO 策略 {idx}",
        "symbol": "ETH/USDC",
        "run_mode": "backtest",
        "venue": "binance.mainnet",
        "return_total": total_ret,
        "annualized_return": ar,
        "max_drawdown": mdd,
        "started_at": started_at,
        "updated_at": updated_at,
    }
    return board, series

def main():
    now_tpe = datetime.now(tz)
    # 隨機 N(2~4)
    N = random.randint(2, 4)

    strategies_index = []
    for i in range(1, N + 1):
        board, series = gen_one_strategy(i, now_tpe)

        # 寫入 board 與 series
        print(f"寫入 board:{board['id']}")
        upstash_set(f"board:{board['id']}", board)

        print(f"寫入 series:{board['id']}:equity({len(series)} 筆)")
        upstash_set(f"series:{board['id']}:equity", series)

        # 索引列(列表頁面只需用到的欄位)
        strategies_index.append({
            "id": board["id"],
            "title": board["name"],
            "symbol": board["symbol"],
            "return_total": board["return_total"],
            "max_drawdown": board["max_drawdown"],
            "updated_at": board["updated_at"],
        })

    print("寫入 strategies:list")
    upstash_set("strategies:list", strategies_index)

    print(f"✔ 完成。共寫入 {N} 條策略。")

if __name__ == "__main__":
    main()
接下來更新github的靜態網頁,要讀取數據庫,每一個Row都是一條策略,要從數據庫讀出有多少條策略已經註冊進資料庫,然後把每條策略都畫出來:
<!DOCTYPE html>
<html lang="zh-Hant">
<head>
  <meta charset="UTF-8" />
  <title>交易策略儀表板(多策略)</title>
  <meta name="viewport" content="width=device-width, initial-scale=1" />
  <script src="https://cdn.jsdelivr.net/npm/chart.js"></script>
  <style>
    :root { --w: 1100px; }
    body { font-family: -apple-system, BlinkMacSystemFont, "Segoe UI", Roboto, "Noto Sans TC", Arial, "Helvetica Neue", sans-serif; margin: 20px; color: #222; }
    h1 { font-size: 22px; margin: 16px 0; }
    .panel { max-width: var(--w); margin: 0 auto; }
    .error { color: #c00; margin: 10px 0; }
    .muted { color: #666; }

    table { width: 100%; border-collapse: collapse; margin: 12px 0 20px; }
    th, td { border-bottom: 1px solid #eee; padding: 10px 8px; text-align: left; }
    th { background: #fafafa; font-weight: 600; }
    tr:hover { background: #f8fbff; }
    .num { text-align: right; font-variant-numeric: tabular-nums; }
    .pos { color: #0b7d34; }
    .neg { color: #b20000; }
    .btn {
      padding: 6px 12px; border: 1px solid #ddd; background: #fff; border-radius: 10px; cursor: pointer;
      transition: box-shadow .15s ease, transform .03s ease;
    }
    .btn:hover { box-shadow: 0 2px 10px rgba(0,0,0,.06); }
    .btn:active { transform: translateY(1px); }
    .toolbar { display: flex; gap: 8px; align-items: center; margin: 8px 0 16px; }
    #chart-wrap { max-width: var(--w); margin: 16px auto 0; }
    #chart-card { border: 1px solid #eee; border-radius: 16px; padding: 16px; box-shadow: 0 8px 24px rgba(0,0,0,.04); }
    #chart-title { margin: 0 0 8px; font-size: 18px; }
    #chart-sub { margin: 0 0 12px; color: #666; font-size: 14px; }
    #chart-container { position: relative; height: 420px; }
  </style>
</head>
<body>
  <div class="panel">
    <h1>交易策略儀表板(多策略)</h1>
    <div id="error" class="error"></div>

    <div class="toolbar">
      <span id="count" class="muted"></span>
    </div>

    <table id="tbl">
      <thead>
        <tr>
          <th style="width:34%;">title</th>
          <th style="width:16%;">symbol</th>
          <th class="num" style="width:16%;">總收益率</th>
          <th class="num" style="width:16%;">最大回撤</th>
          <th style="width:18%;">按鈕</th>
        </tr>
      </thead>
      <tbody id="tbody"></tbody>
    </table>

    <div id="chart-wrap" style="display:none;">
      <div id="chart-card">
        <h3 id="chart-title"></h3>
        <p id="chart-sub" class="muted"></p>
        <div id="chart-container">
          <canvas id="myChart"></canvas>
        </div>
      </div>
    </div>
  </div>

  <script>
    // ====== Upstash 讀取設定(只放 Read-Only Token)======
    const REST_URL = "";   // 你的 Upstash REST_URL
    const READ_TOKEN = ""; // Read-Only Token
    const headers = { "Authorization": `Bearer ${READ_TOKEN}` };

    // ====== Utils ======
    const $ = (sel) => document.querySelector(sel);
    const fmtPct = (x) => {
      const s = (x * 100).toFixed(2) + "%";
      return x >= 0 ? `<span class="pos">${s}</span>` : `<span class="neg">${s}</span>`;
    };
    const fmtDrawdown = (x) => `<span class="${x <= 0 ? 'neg' : 'pos'}">${(x * 100).toFixed(2)}%</span>`;

    async function upstashGet(key) {
      const res = await fetch(`${REST_URL}/get/${key}`, { headers });
      if (!res.ok) throw new Error(`GET ${key} failed: ${res.status}`);
      const data = await res.json();
      try { return JSON.parse(data.result); } catch { return data.result; }
    }

    // ====== 狀態 ======
    let strategies = [];      // N 策略
    let chart;                // Chart.js 實例
    const cache = new Map();  // 快取 board/series

    function renderTable() {
      const tbody = $("#tbody");
      tbody.innerHTML = "";

      for (const s of strategies) {
        const tr = document.createElement("tr");
        tr.innerHTML = `
          <td>${s.title}</td>
          <td>${s.symbol}</td>
          <td class="num">${fmtPct(s.return_total)}</td>
          <td class="num">${fmtDrawdown(s.max_drawdown)}</td>
          <td><button class="btn" data-id="${s.id}">查看圖表</button></td>
        `;
        tbody.appendChild(tr);
      }

      // 綁定按鈕
      tbody.querySelectorAll("button[data-id]").forEach(btn => {
        btn.addEventListener("click", () => showChart(btn.dataset.id));
      });

      // 顯示列數(N),含表頭視覺上為 N+1 行
      $("#count").textContent = `共 ${strategies.length} 策略(表格行數:${strategies.length + 1},含表頭)`;
    }

    async function showChart(id) {
      try {
        $("#chart-wrap").style.display = "block";

        // 讀 board + series(快取)
        let board = cache.get(`board:${id}`);
        if (!board) {
          board = await upstashGet(`board:${id}`);
          cache.set(`board:${id}`, board);
        }
        let series = cache.get(`series:${id}:equity`);
        if (!series) {
          series = await upstashGet(`series:${id}:equity`);
          cache.set(`series:${id}:equity`, series);
        }

        // 標題與摘要
        $("#chart-title").textContent = `${board.name}(${board.symbol})`;
        $("#chart-sub").textContent =
          `總收益率:${(board.return_total * 100).toFixed(2)}% | 年化:${(board.annualized_return * 100).toFixed(2)}% | 最大回撤:${(board.max_drawdown * 100).toFixed(2)}% | 期間:${(board.started_at ?? "").slice(0,10)} ~ ${(board.updated_at ?? "").slice(0,10)}`;

        // 準備資料
        const labels = series.map(d => d.date);
        const equity = series.map(d => d.equity);
        const price = series.map(d => d.eth_close);

        // 畫圖或更新
        const ctx = document.getElementById("myChart").getContext("2d");
        if (!chart) {
          chart = new Chart(ctx, {
            type: "line",
            data: {
              labels,
              datasets: [
                { label: "Equity", data: equity, borderColor: "blue", borderWidth: 2, tension: .1, yAxisID: "y" },
                { label: "ETH Close", data: price, borderColor: "orange", borderWidth: 2, tension: .1, yAxisID: "y1" }
              ]
            },
            options: {
              maintainAspectRatio: false,
              responsive: true,
              interaction: { mode: "index", intersect: false },
              stacked: false,
              plugins: { legend: { display: true } },
              scales: {
                y:  { type: "linear", position: "left",  title: { display: true, text: "Equity" } },
                y1: { type: "linear", position: "right", title: { display: true, text: "ETH Price" }, grid: { drawOnChartArea: false } }
              }
            }
          });
        } else {
          chart.data.labels = labels;
          chart.data.datasets[0].data = equity;
          chart.data.datasets[1].data = price;
          chart.update();
        }
      } catch (err) {
        $("#error").textContent = "❌ 載入錯誤:" + (err?.message || err);
      }
    }

    (async function main() {
      try {
        // 讀取清單(N 策略)
        strategies = await upstashGet("strategies:list");
        if (!Array.isArray(strategies)) throw new Error("strategies:list 格式錯誤");
        renderTable();

        // 可選:預設先秀第一列的圖
        if (strategies.length) showChart(strategies[0].id);
      } catch (err) {
        $("#error").textContent = "❌ 初始化失敗:" + (err?.message || err);
      }
    })();
  </script>
</body>
</html>
在Notion裡面遷入embed,在embed輸入儀表板的網址: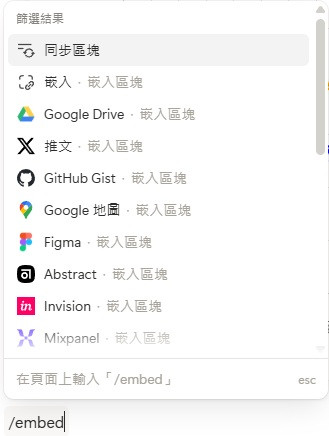
儀表板中輸入網址:


 iThome鐵人賽