「讓 LSTM 看懂時間的節奏。」昨天我們讓模型學會「數數」,今天讓它學會「聽懂節奏」——從波形中找出規律。
本日目標
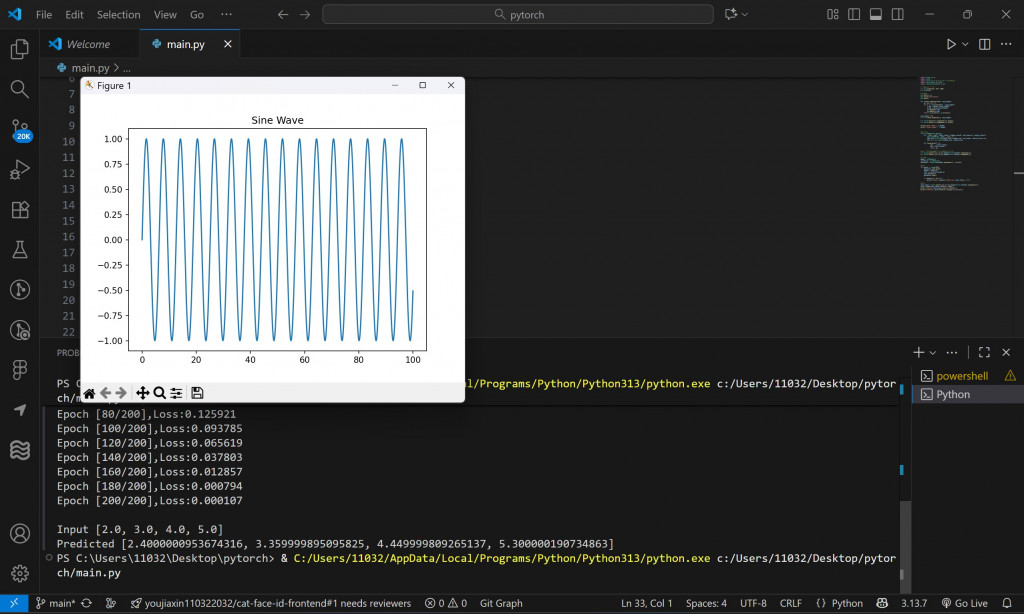
我們使用 numpy 產生一條平滑的正弦波,並切成訓練與測試資料。
import numpy as np
import torch
import torch.nn as nn
import torch.optim as optim
import matplotlib.pyplot as plt

# 產生 sin 波資料
x = np.linspace(0, 100, 1000)
y = np.sin(x)

# 視覺化
plt.plot(x, y)
plt.title("Sine Wave")
plt.show()
這條波代表了隨時間變化的週期性現象,比如:聲音頻率波形、心率資料、溫度變化
LSTM 不看「單點」,而是看「一段時間」,我們要用滑動視窗切出固定長度的序列。
def create_sequences(data, seq_length):
    xs, ys = [], []
    for i in range(len(data) - seq_length):
        x_seq = data[i:i+seq_length]
        y_seq = data[i+seq_length]
        xs.append(x_seq)
        ys.append(y_seq)
    return np.array(xs), np.array(ys)

seq_length = 50
X, Y = create_sequences(y, seq_length)

X = torch.tensor(X).unsqueeze(-1).float()
Y = torch.tensor(Y).unsqueeze(-1).float()

print("Input shape:", X.shape)
print("Target shape:", Y.shape)
輸出:
Input shape: torch.Size([950, 50, 1])
Target shape: torch.Size([950, 1, 1])
沿用上一篇的結構,這次要輸入整段時序。
class LSTMModel(nn.Module):
    def __init__(self, input_size=1, hidden_size=64, num_layers=2, output_size=1):
        super(LSTMModel, self).__init__()
        self.lstm = nn.LSTM(input_size, hidden_size, num_layers, batch_first=True)
        self.fc = nn.Linear(hidden_size, output_size)

    def forward(self, x):
        out, _ = self.lstm(x)
        out = self.fc(out[:, -1, :])  # 只取最後一個時間步
        return out

model = LSTMModel()
criterion = nn.MSELoss()
optimizer = optim.Adam(model.parameters(), lr=0.001)
epochs = 50
for epoch in range(epochs):
    optimizer.zero_grad()
    output = model(X)
    loss = criterion(output, Y)
    loss.backward()
    optimizer.step()

    if (epoch+1) % 10 == 0:
        print(f"Epoch [{epoch+1}/{epochs}], Loss: {loss.item():.6f}")
讓模型預測後續 200 個點。
model.eval()
preds = []
input_seq = X[-1].unsqueeze(0)

for _ in range(200):
    with torch.no_grad():
        pred = model(input_seq)
        preds.append(pred.item())
        input_seq = torch.cat((input_seq[:, 1:, :], pred.unsqueeze(0)), dim=1)

# 視覺化
plt.figure(figsize=(10,4))
plt.plot(range(len(y)), y, label="True Wave")
plt.plot(range(len(y), len(y)+len(preds)), preds, label="Predicted Wave", color="orange")
plt.legend()
plt.title("LSTM Sine Wave Prediction")
plt.show()
模型學會了「延續」波形的趨勢,隨著訓練次數增加,它會越接近真實 sin 波的週期。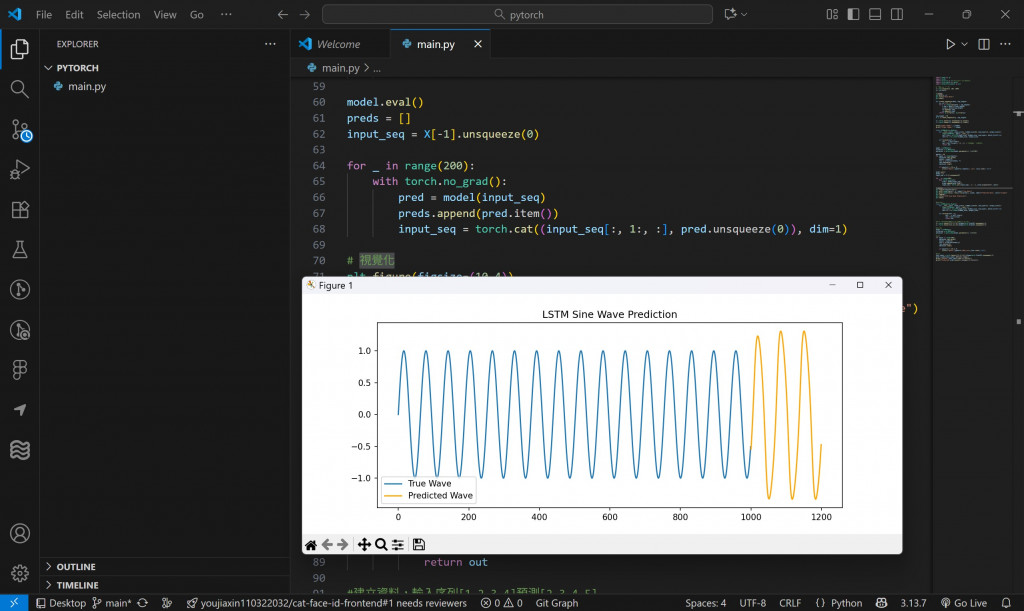


 iThome鐵人賽