
OpenTelemetry(OTel) 是一套開放原始碼的 observability framework,用來產生、收集與匯出 Metrics、Logs 和 Traces。它不負責儲存資料,也不提供 dashboard;Prometheus、Loki、Jaeger 與各種 SaaS backend 仍負責保存資料,Grafana 則負責查詢與呈現。OTel 提供的是共用的資料格式、欄位命名與傳輸方式,讓 application 不必各自綁定特定 vendor 的 SDK。
接下來都會以 Todo 系統為例,前幾天我們讓 Ingress 的 /api 直接導向 todo-api,這次為了驗證跨服務的 Trace Context,我們在 Web 入口與 API 之間新增 todo-bff 服務:瀏覽器先呼叫 BFF,BFF 再以 HTTP 呼叫 todo-api。這個 BFF 目前只負責轉送 Todo API,不是為了再包一層商業邏輯;它提供一段真實的服務間呼叫,讓我們能確認同一筆請求的 Trace 是否能從 BFF 接到 API。
目前 Todo 資料保存在 API process 的記憶體中,因此這條流程沒有資料庫呼叫或資料庫 span。BFF 與 todo-api 同時會把執行過程產生的 Metrics、Logs 和 Traces,以 OpenTelemetry Protocol(OTLP)送到 OpenTelemetry Collector。Collector 處理完資料後,再分別送到各種 backend。
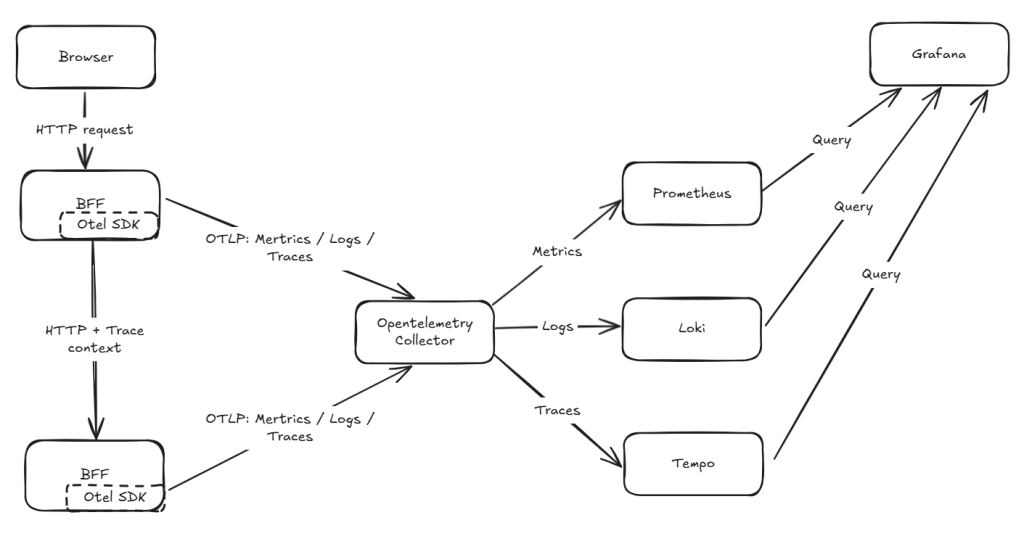
Collector 不會處理 BFF 呼叫 todo-api 的 HTTP request。它收到的是服務額外送出的 telemetry。這也是為什麼服務發生錯誤時,Collector 可以幫助我們看見問題,但不會讓原本失敗的請求自動成功。
一筆請求的 Trace 由多個 span 組成。BFF 處理 HTTP request 時會建立一個 span;它呼叫 todo-api 時,todo-api 會建立另一個 span;建立 Todo 的業務處理也會建立 todo.create span。這些 span 共享同一個 trace ID,backend 才能把它們排成同一條呼叫路徑。
BFF 不會把整份 Trace 傳給 todo-api,而是把目前的 context 寫進 HTTP header。todo-api 讀取這個 context 後,會將 server span 接到 BFF 呼叫 API 時建立的 HTTP client span 之下。OTel 預設使用 W3C Trace Context 定義的 traceparent header;常見的 HTTP instrumentation library 能自動注入與讀取這個 header。
Trace ID: 4bf92f3577b34da6a3ce929d0e0e4736

Browser 傳入的 parent span
└─ todo-bff:POST /api/{**path}       # server span
   └─ todo-bff → todo-api:POST       # HTTP client span
      └─ todo-api:POST /api/todos    # server span
         └─ todo.create               # API 自訂的業務 span
BFF 收到請求後會建立 server span。它呼叫 todo-api 時,HttpClient 會再建立一個 client span,並把這個 client span 的 ID 寫入 outgoing request 的 traceparent。因此 API 建立的 server span 會接在 client span 之下,而不是直接接在 BFF 的 server span 之下。
如果 context 沒有傳過去,BFF 和 todo-api 還是會各自留下 Trace,只是 backend 會把它們當成兩筆不相干的請求。驗證時要分別檢查 span 是否建立,以及 context 是否有跨服務傳遞。
OTel 將 application 產生 telemetry 的方式,和資料要送到哪裡分開處理:
| 元件 | 工作 | Todo 系統中的用途 |
|---|---|---|
| API | 提供建立 span、metric 與 log 的程式介面 | application 以相同介面記錄業務事件 |
| SDK | 實作 API,負責抽樣、處理與匯出 | BFF 與 todo-api 啟動時設定 resource 與 exporter |
| Instrumentation library | 為 HTTP framework、資料庫 client 等常用套件產生 telemetry | 建立 HTTP 等通用 span |
| Semantic Conventions | 定義常見 operation 與 attribute 的名稱和語意 | 讓不同服務對 HTTP method、route 與 status code 使用同一組欄位 |
| OTLP | 定義 telemetry 的資料格式與傳輸方式 | application 與 Collector 之間的通訊協定 |
| Collector | 接收、處理及轉送 telemetry | 處理 retry、batch、脫敏與 backend 連線設定 |
Instrumentation 可以從兩個地方開始。若使用的 HTTP framework 或資料庫 client 已有支援,加入對應的 instrumentation library 後,通常可以取得 HTTP request 和 SQL 呼叫等資料。這適合先建立服務的基本觀測能力。
另一部分只有 application 自己知道。例如「建立待辦事項被拒絕,因為標題不符合規則」不是 HTTP framework 能判斷的事件,需要在程式碼中主動建立 span、log 或 metric。自動 instrumentation 和程式碼 instrumentation 可以一起使用;前者處理共通元件,後者補上業務語意。
OTel 的資料格式相同,不代表欄位內容就會一致。todo-api 的 HTTP method、route 和資料庫操作等欄位,可以依 Semantic Conventions 命名;服務名稱、部署環境和版本則應以 resource attributes 表示。
resource attributes 描述的是產生 telemetry 的服務或工作負載,通常在 application 啟動時決定。每次 HTTP request 都不同的 route、response status 與錯誤類型,則是 span、metric datapoint 或 log record 的 attributes。
Todo 系統的 BFF 與 API 都在啟動時設定下面這組 resource attributes,並以 OTLP 將 telemetry 送到 Collector:
# todo-api 的 resource attributes;todo-bff 使用自己的 service.name
service.name: todo-api
service.namespace: todo
service.version: "0.1.0"
deployment.environment.name: staging
| 欄位 | 用途 |
|---|---|
service.name |
查詢同一服務的 Metrics、Logs 與 Traces,例如 todo-api。應明確設定,避免 SDK 使用 unknown_service。 |
service.namespace |
區分邏輯上的服務群組;不必等同 Kubernetes Namespace。 |
service.version |
比較不同部署版本的錯誤率與延遲。 |
deployment.environment.name |
區分 Staging 與其他環境,避免資料混在一起。 |
trace_id 是每次請求才產生的識別值,應出現在 Trace 和相關 Log,不能當成 resource attributes 或 Metric label。Metrics 只適合使用服務名稱、環境、正規化 route 和 status code 這類有限集合的欄位;request ID、user ID 和原始 URL path 則留在 Trace 或 Log。
request body、Authorization header、token、email 和 Todo 內容不應寫進 telemetry。Collector 的過濾是最後一道防線,application 本身不產生這些資料,才能避免它們進入集中式 backend。
小型或本機環境中,application 可以直接將 telemetry 送到 backend。不過服務一多,每個服務都要各自設定 retry、batch、敏感欄位過濾,以及 Metrics、Logs 和 Traces 的 backend endpoint。設定很容易逐漸不同。
Collector 接收 OTLP 與其他格式的 telemetry,處理或過濾後,再送到一個或多個 backend。application 只要設定 OTLP endpoint,不必知道 Prometheus、Loki 或 tracing backend 的連線細節。
Collector 可以在資料送出前移除敏感 attribute,但這不代表 application 可以先把敏感資料寫進 span 或 log。application 不建立不必要的資料,Collector 再檢查和過濾,兩者缺一不可。
OTLP 的回應只表示相鄰兩個節點之間的一次傳輸是否被接受。例如 application 收到 Collector 的成功回應,不能據此判斷資料已寫入最終 backend。Collector 到 backend 的傳輸仍需要各自處理。
下一篇會以這篇定下來的資料流為基礎,設定 Collector 的 Receiver、Processor 與 Exporter。application 將資料送進 OTLP receiver,Collector 再依序處理記憶體保護、共同屬性、敏感欄位與批次轉送。



 iThome鐵人賽
 看影片追技術