完整範例:http://wcc723.github.io/d3js/2014/10/19/Ironman-30-days-20/
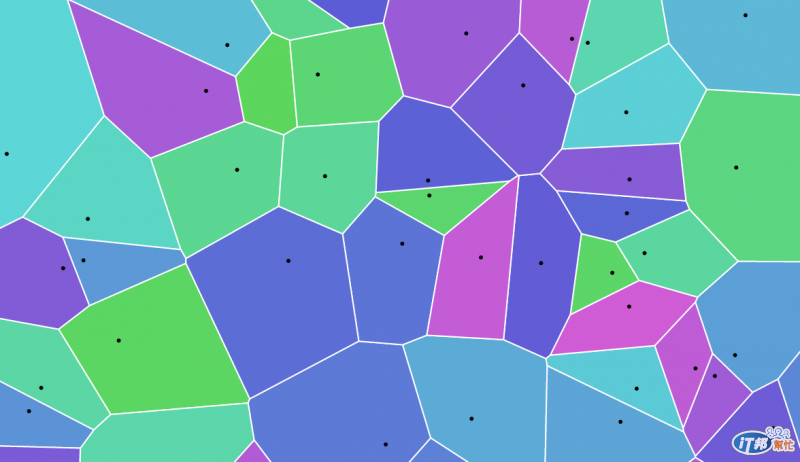
Voronoi Diagram這個繪圖我在Blog的Banner上,主要原因也是因為他很有趣,除了視覺感外,它還包含了簡單的互動。
來源:http://bl.ocks.org/mbostock/4060366
這個繪圖的方式,經過我同事的指點,我才發現他是有理論基礎的(可參考:http://www.csie.ntnu.edu.tw/~u91029/VoronoiDiagram.html),然而D3.js內建這樣的Layout不經讓我覺得對D3.js的誤會很大,原本認為D3.js是繪製資料圖表而已,但在透過上面那個理論的網站,會發現很多很多的數學原理,都和D3.js有些關聯。
Voronoi Diagram 是大自然的圖案,諸如長頸鹿的斑紋、蜻蜓的翅膀、葉片的細胞壁。應用相當廣泛。
在這一個範例中,一開始會先繪製一個Voronoi Diagram圖案,接下來滑鼠滑過之後,會替換掉其中一個,並且會隨著滑鼠的移動不斷的改變其週邊的外形。

var svgSize = {
		w : 960,
		h : 500
	}

	var hslValue = 3;

	var vertices = d3.range(100).map(function(d) {
		return [Math.random() * svgSize.w, Math.random() * svgSize.h];
		//產生100個坐標,位置是隨機的
	});

	console.log(vertices)

	var voronoi = d3.geom.voronoi() //套用voronoi,這段只有裁切區域
		.clipExtent([[0,0], [svgSize.w , svgSize.h]])
		//裁切voronoi區域

	var svg = d3.select('.chart').append('svg')
		.attr('width', svgSize.w)
		.attr('height', svgSize.h)
		.on('mousemove', function() {
			vertices[0] = d3.mouse(this);//殘忍地將第一個替換掉
			redraw();
			//將滑鼠的坐標帶入redraw
		})

	var path = svg.append('g').selectAll('path'); //等等要用path來畫間隔線

	svg.selectAll('circle')
		.data(vertices) //將剛剛產生的x,y插入
		.enter().append('circle') //補上原點的位置
		.attr('transform', function(d){ return 'translate(' + d + ')'; }) //位置坐標如資料
		.attr('r', 1.5) //大小是1.5px

	redraw()

	function redraw(){
		path = path.data(voronoi(vertices) , polygon)
		// voronoi(vertices) 會傳回path 所需要的路徑坐標
		// 然後用polygon function執行

		path.exit().remove();
		//如果多餘就移除

		path.enter().append('path')
			.attr('d', polygon) //調用下方的polygon函示
			.style('fill', function(d, i){ return d3.hsl((120 + i * hslValue % 360),.6,.6)})

		path.order(); //這段似乎有沒有都沒差...
	}

	function polygon(d) {
		console.log(d)
		return "M" + d.join("L") + "Z";
	}
另外我的Blog上的Banner,也是這個方式去做出來的,只是改變了兩個效果:
原始碼在https://github.com/Wcc723/wcc723.github.io/blob/master/assets/themes/casper2013/js/d3_banner.js,有興趣的可以參考看看~(無註解)
