完整範例:http://wcc723.github.io/d3js/2014/10/18/Ironman-30-days-19/
D3js除了繪製圖表外,還有許多開發者拿來作為視覺或者互動效果,假日的文章,就來介紹一些網路上所找到的效果。
抱怨...,今天中華電信網路出問題,附近的商家...捷運站網路也都掛了,害我跑很遠才有網路可用...> <。
在學D3的過程中,除了看書就是不斷的找範例,有些範例並不是實用型,只是些效果,但是可以從中看到別人怎麼活用D3.js。
範例來源:http://bl.ocks.org/mbostock/1062544
這一個範例中我認為最重要是他所寫的滑鼠、觸控監聽事件,範例如下:
svg.append('rect').attr('width', width)
	.attr('height', height)
	.on('ontouchstart' in document ? 'touchmove' : 'mousemove', particle);
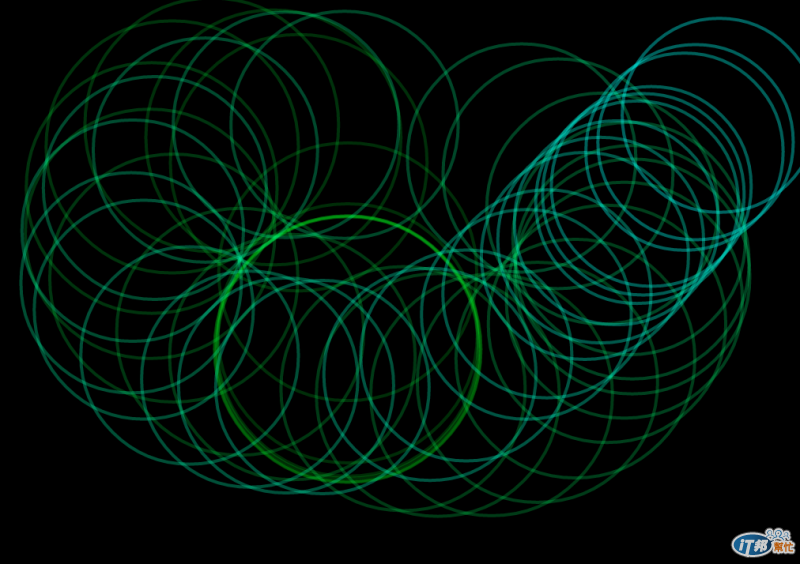
在下面黑色區域滑動滑鼠,或者是用觸控都可以有圓圈圈的效果。範例請到:http://wcc723.github.io/d3js/2014/10/18/Ironman-30-days-19/
var	width = 600,
	height = 500;

var i = 0; //場上圓圈的數量,預設是0

var svg = d3.select('.demo').append('svg') //插入SVG
		.attr('width', width)
		.attr('height', height);

svg.append('rect').attr('width', width)
	.attr('height', height)
	.on('ontouchstart' in document ? 'touchmove' : 'mousemove', particle);
	//偵測是滑鼠還是觸控事件


function particle(){
	var m = d3.mouse(this)
	//m是陣列,只有x,y 坐標

	svg.insert('circle', 'rect') //在rect內新增circle
		.attr('cx', m[0])//滑鼠x坐標
		.attr('cy', m[1])//滑鼠y坐標
		.attr('r', 1e-6) //(0.000001 ,科學計算法)
		.style('stroke', d3.hsl((i = (i+1) % 360), 1, .5))
		//(i = (i+1) % 360) 取餘數
		.style('stroke-opacity', 1) //一開始是不透明
		.transition() //轉場效果
		.duration(2000) //動畫轉場時間2秒
		.ease(Math.sqrt) //取得平方根,不懂在這邊有什麼意義
		.attr('r', 100) //不斷放大
		.style('stroke-opacity', 1e-6) //轉變成半透明
		.remove(); //時間到後移除物件

	d3.event.preventDefault();	//移除預設事件
}
明天要介紹我部落格上方的Banner喔~


 iThome鐵人賽