除了 3D 場景製作比較方便之外,我們可以使用 aframe 搭配其他不同的框架來做另類的前端呈現。今天的介紹主要是讓各位了解,除了遊戲場景的應用之外,我們也可以用 VR 來呈現畫面或資訊。
今天主要會介紹用 d3 跟 aframe 來畫出 3D 圖表,範例只是最基本的長條圖。大家可以用其他的圖表來呈現資訊,3D 的世界創造了更多可能性,就看各位前端的創意了!
<a-scene>
  <a-light color="#27cc95" position="1 0 0" type="ambient"></a-light>
  <a-entity light="type: point; color: #fff; intensity:0.5" position="0 5 0"></a-entity>
  <a-entity position="0 0 0" rotation="0 0 0">
  	<a-entity camera look-controls wasd-controls>
    </a-entity>
  </a-entity>
</a-scene>
首先我們加入了 a-scene ,scene 對 aframe 來說是所有的 entity 的根元素。主要的用途有:
scene 裡頭加入 UIA scene is represented by the
<a-scene>element. The scene is the global root object, and all entities are contained within the scene.
剩下的就是加入光線跟 camera 。官方文件並沒有寫得很清楚 type 的類型有哪些,不過基本上有:
這三大光源。
另外我們設定了兩個實體,一個是點光源,另外一個則是 camera。
d3 的部分,這邊就不多說明了。
var data = [
  120, 10, 13, 45, 67,
  54, 12, 22, 200, 120,
  123, 154, 243, 100, 40,
  44, 45, 65, 16, 94, 33
];

var hscale = d3.scale
  .linear()
  .domain([0, d3.max(data)])
  .range([0,10])

var scene = d3.select("a-scene");

var cubes = scene
  .selectAll("a-cube.bar")
  .data(data)
  .enter()
  .append("a-cube")
  .classed("bar", true)
  .attr({
    position: function(d,i) {
      var radius = 10;
      var theta = (i/data.length) * (2 * Math.PI)
      var x = radius * Math.cos(theta);
      var y = hscale(d)/2;
      var z = radius * Math.sin(theta);
      return x + " " + y + " " + z
  	},
  	rotation: function(d,i) {
      var x = 0;
      var y = -360 * i / data.length;
      var z = 10;
      return x + " " + y + " " + z
  	},
  	height: function(d,i) {
      return hscale(d)
  	}
  });
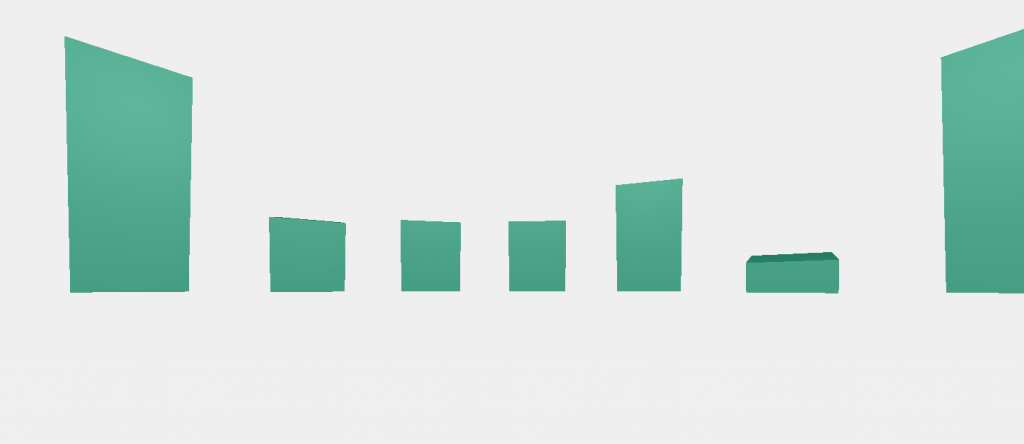
我們將資料用 a-cube 呈現,在這邊我們計算了每筆資料的 xyz 分量後,讓他們圍繞著 camera 平均分佈。這樣子一來,我們的長條圖呈現就完成了。
aframe 會自動將我們所寫的 tag 全部轉為 canvas,這樣子我們就可以輕易地用 HTML tag 來做開發,也比較方便 debug。
成果圖就會像這樣:
不過,是否要用這種方式呈現資訊,會不會顯得太多餘?這方面的考量就交給各位前端工程師們評估了,選擇最好的呈現方式才是我們最重要的工作。不過學會了 aframe 這一大利器,我們有更多的展現方式了。
