第一個教學就先用dplyr 當開頭吧,在我還沒使用過dplyr 時,每次對有相同特徵的資料做分群並運算時,常常把R 寫的非常奇怪...,不僅在程式碼閱讀上困難,效能上也可能非常低落,所以第一個問題開始...,如何知道網站的註冊會員狀況?
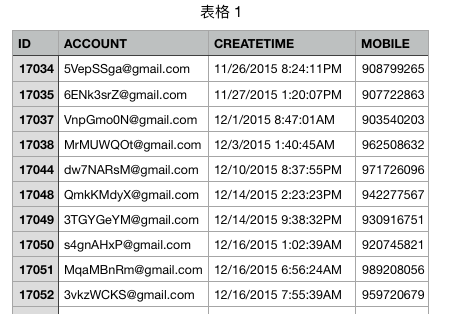
使用read.csv 將資料載入
user = read.csv("input/user.csv", stringsAsFactors=FALSE)
#install.packages("stringr")
library(dplyr)
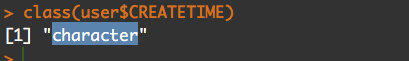
至於如何分析問題呢? 我第一個想法是:利用CREATETIME 時間分出不同月份,在看每個月份註冊的會員總數是多少,因此我需要創建一個新欄位:Month,但目前CREATETIME 的儲存欄位還是character
再來就是要介紹dplyr 的mutate 功能,mutate可以為原先的dataframe 新增一個新的欄位,因此我們這樣子寫
result <- user %>%
    mutate(Month = as.Date(user$CREATETIME, "%m/%d/%Y %H:%M:%S"))
就取得了Month結果
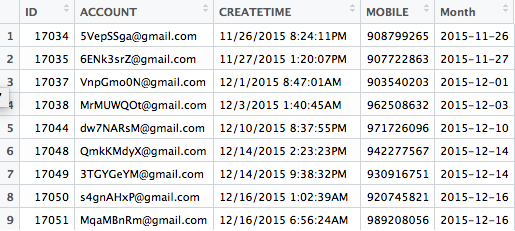
但因為我們是用月份來切割的,因此只需要取得前面7個字,所以再呼叫mutate一次並使用substring() 取字。
result <- user %>%
    mutate(Month = as.Date(user$CREATETIME, "%m/%d/%Y %H:%M:%S")) %>%
    mutate(Month = substring(Month,1,7))
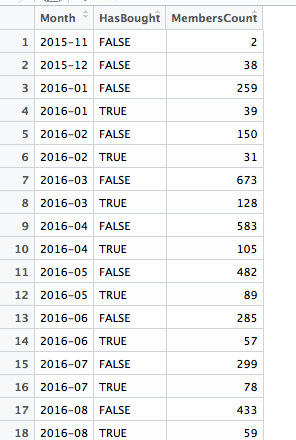
接再來介紹dplyr 的group_by() 和summarise() 函式,group_by可以將你指定的同個特徵集合一起,再利用summarise() ,取得結果,其中,可以用n() 來得出被group的筆數。
result <- user %>%
    mutate(Month = as.Date(user$CREATETIME, "%m/%d/%Y %H:%M:%S")) %>%
    mutate(Month = substring(Month,1,7)) %>%
    group_by(Month) %>%
    summarise(MembersCount = n())
這樣就完成了各個月份註冊人數的統計
再利用ggplot 畫出圖表
library(ggplot2)

ggplot(result, aes(x=Month, y=MembersCount)) +
    geom_bar(stat="identity", fill="skyblue")
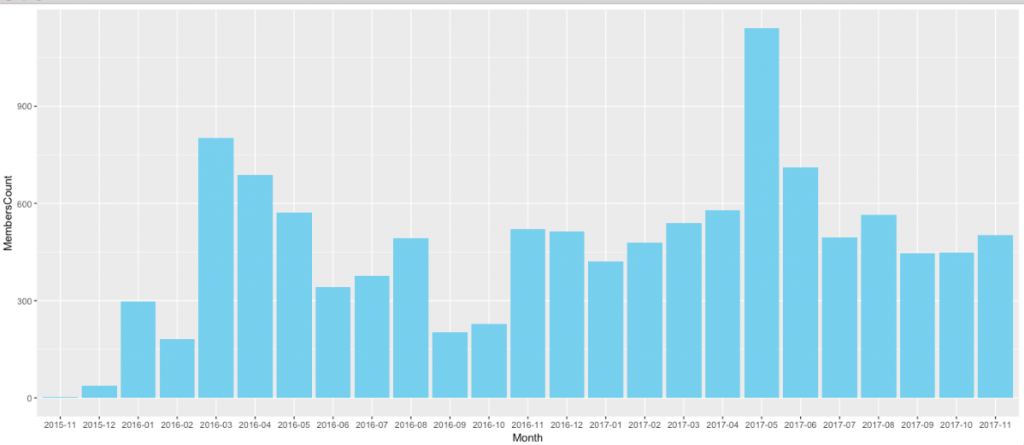
因此,你就可以拿著這張圖表去報告目前會員的註冊狀況囉!
ref: day2原始碼


 iThome鐵人賽