這次要介紹的是分析地址,在R 的套件當中,有個非常有名的套件叫做ggmap ,後面幾天我會一一講解之前我用了哪些功能,首先一樣,你必須要先安裝相關套件。
#install.packages("ggmap")
library(ggplot2)
library(ggmap)
安裝完成後,先用下列的程式碼當作hello world。
google_map <- get_googlemap()
ggmap(google_map)
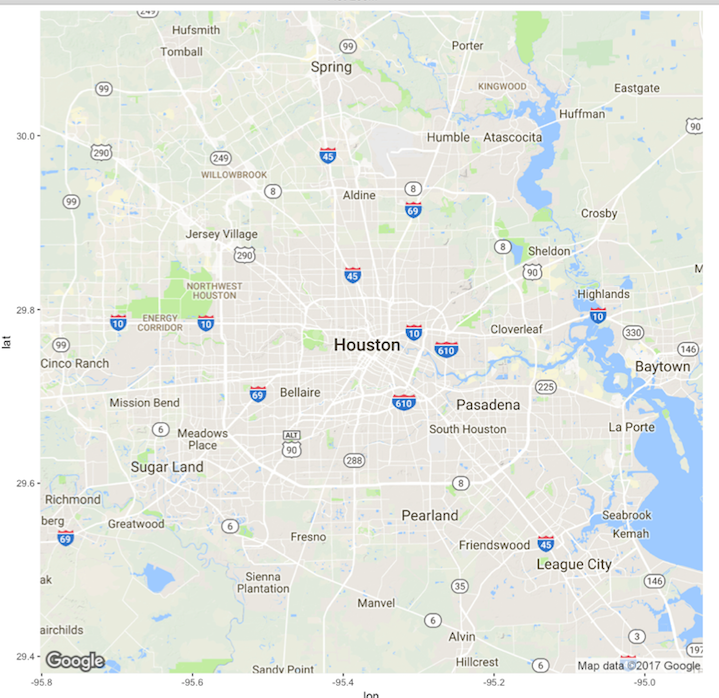
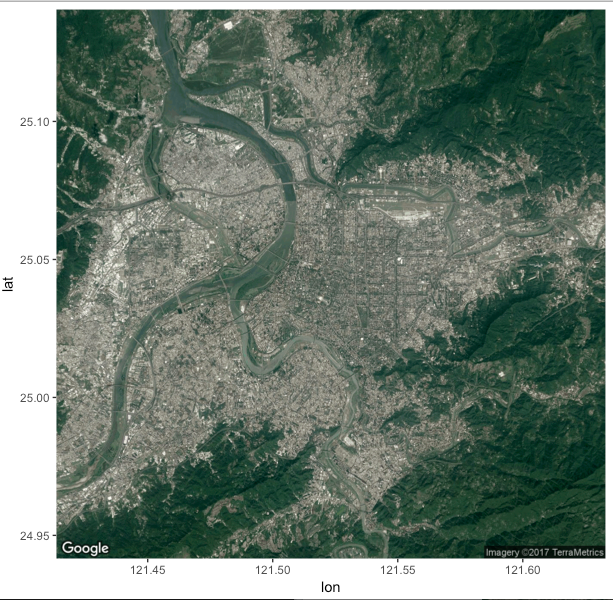
接下來,我們加一些參數,把範圍縮小到雙北地區,center 是這次畫地圖的中心點經緯度座標,zoom是放大等級,maptype是地圖種類,以google map 來說,satellite是衛星圖,terrain
是地形圖,roadmap主要是街道圖,這邊範例我們用衛星圖來畫。
google_map <- get_googlemap(center=c(121.52311,25.04126), zoom=12, maptype='satellite')
ggmap(google_map)
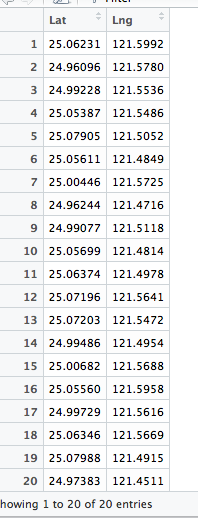
再來要介紹的,是在地圖上標記位置,這時可以結合ggplot 一起使用,首先我先創了20 個經緯度在台北附近的座標。
LatLngData <- data.frame(
Lat = runif(20, 24.96, 25.11),
Lng = runif(20, 121.44, 121.60))
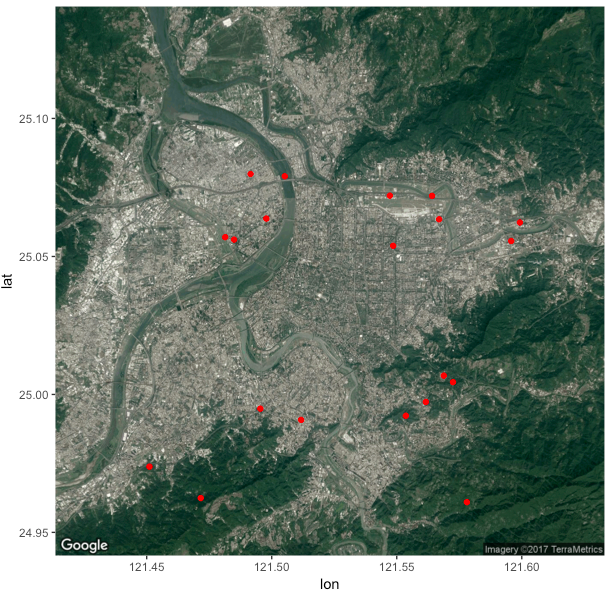
然後搭配ggplot 畫出紅點。
google_map <- get_googlemap(center=c(121.52311,25.04126), zoom=12, maptype='satellite')
ggmap(google_map) +
    geom_point(data=LatLngData, aes(x=Lng, y=Lat), colour='red')
以上就是ggmap的基礎篇,之後我們會再結合google map 的其他API 應用,今天也是2017 的最後一天,祝大家新年快樂^^
ref
day14原始碼