一開始訂下這個題目,是希望能夠將兩者整合應用,來做個嘗試吧
這次把d3寫到vue之中,利用vue來讀取檔案,並且將部分的設定值寫在vue的data之中,順利的將兩者結合。
var color = d3.scaleOrdinal()
    .range(d3.schemeCategory20);

var app = new Vue({
	el: '#app',
	data:{
		jsonurl:"https://raw.githubusercontent.com/FWcloud916/TWcity/master/taiwan.json",
		geojson:[],
		width:650,
		height:650,
		center:[121,24],
		title:"臺灣",
	},
	mounted: function(){
		this.getGeoJson();
	},
	methods:{
		getGeoJson: function(){
			axios.get(this.jsonurl)
			.then(function(response){
				app.geojson = response.data
				console.log("app.geojson.features");
				app.drawMap();
			})
		},

		drawMap:function(){
			var svg = d3.select("#app").append("svg")
				.attr("width", this.width)
				.attr("height", this.height);
			var g = svg.append("g");

			var projection = d3.geoMercator()
				.center(this.center)
				.scale(10000)

			var path = d3.geoPath()
				.projection(projection);
			var map = d3.select("g").selectAll("path")
				.data(this.geojson.features)
				.enter()
				.append("path")
				.attr("d", path)
				.attr('stroke','black')
				.attr('stroke-width', "1")
				.attr('fill','#184200')
				.on("mouseover", function(d,i) {
					d3.select(this).attr("fill", color(i));
					app.title = d.properties['COUNTYNAME']
				})
				.on("mouseleave", function(d) {
					d3.select(this).attr("fill", "#184200");
					app.title = "臺灣"
				});
		}
	}
});
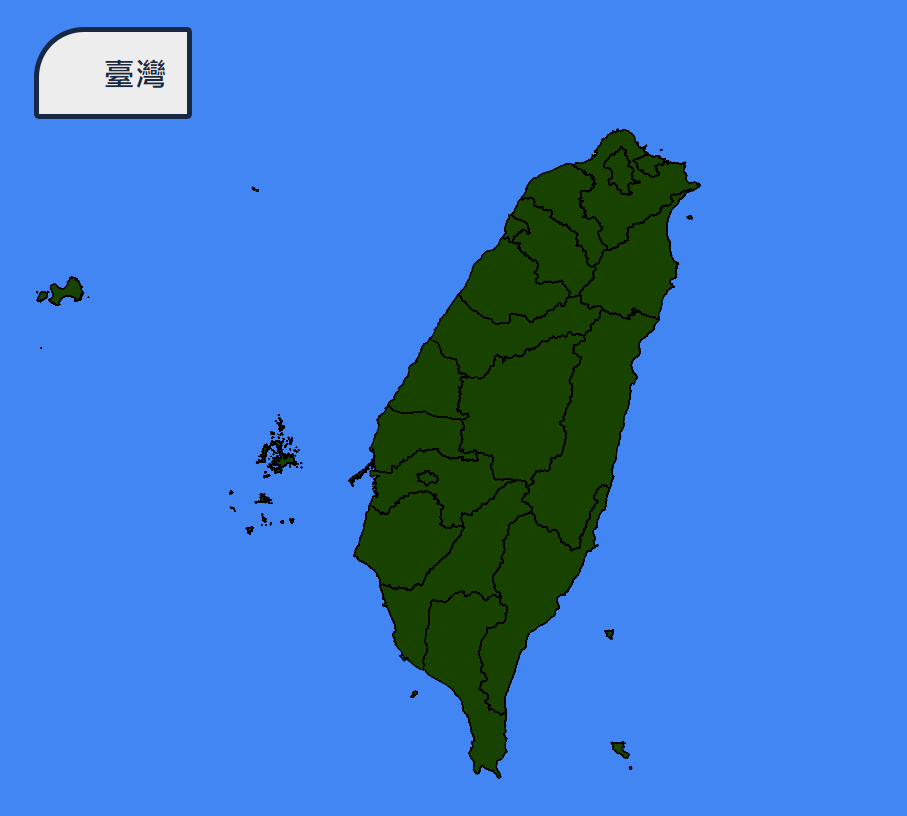
結果如圖
demo&code : https://codepen.io/FanWay/pen/aEQzNL
雖然這個範例並沒有真正發揮兩者的特性,但是可以留下一個想法,當vue的data可以放到d3之中使用時,我想應該就代表能利用vue來操縱d3。
vue跟d3原本就都具有非常好的互動性,但是vue的即時變動、更新資料是d3不容易做到的,而d3強大的繪圖能力是vue缺少的,在這樣的組合之下,應該可以創造更多元、及時的互動,讓資料視覺化變得更多采多姿,並且充滿感染力。
30天到此結束,謝謝大家,真的是又累又爽快的30天![]()
