利用tree
來繪製樹狀圖,樹狀圖可以用來表達資料中的階層關係
利用d3繪製樹狀圖之前,需要先將資料整理成json的格式,並且依照規定用name及children來做為節點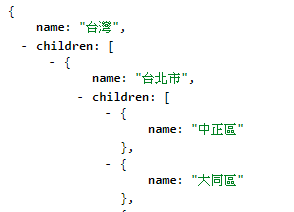
這裡使用d3.json來獲取事先準備的json檔,有了json之後,須利用hierarchy()來產生樹狀圖所需要的其他資料(好方便阿!),稍微需要注意的是利用d3.json獲取資料後,須將繪製圖表的程式碼寫在d3.json的匿名函式中
var datapath='https://raw.githubusercontent.com/FWcloud916/TWcity/master/city.json';
d3.json(datapath,function(d){
  var root = d3.hierarchy(dataset);
接下來正式來把樹畫出來,先定義一些樹的細節,再將資料放進去
size:樹的高度、寬度
separation:節點的間隔
  var tree = d3.tree()
    .size([height, width])
    .separation(function(a, b) {
      return (a.parent == b.parent ? 1 : 2);
    });

  tree(root); //將資料放進去
接下來把節點跟線畫上去
descendants是用來回傳節點所接的資料數目,slice是用來去掉不需要的,根節點(台灣)是樹根沒有連到它的線,所以利用slice來刪去
  var link = svg.selectAll(".link")
      .data(root.descendants().slice(1))
    .enter().append("path")
      .attr("class", "link")
      .attr("d", function(d) {
        return "M" + d.y + "," + d.x
            + "C" + (d.y + d.parent.y) / 2 + "," + d.x
            + " " + (d.y + d.parent.y) / 2 + "," + d.parent.x
            + " " + d.parent.y + "," + d.parent.x;
      });

  var node = svg.selectAll(".node")
      .data(root.descendants())
    .enter().append("g")
      .attr("class", function(d) {
        return "node" + (d.children ? " node--internal" : " node--leaf");
      })
      .attr("transform", function(d) {
        return "translate(" + d.y + "," + d.x + ")";
      });

  node.append("circle")
      .attr("r", 5);

  node.append("text")
      .attr("dy", 3)
      .attr("x", function(d) {
        return d.children ? -8 : 8;
      })
      .style("text-anchor", function(d) {
        return d.children ? "end" : "start";  //判斷是葉節點或是根結點,來決定文字在前或後
      })
      .text(function(d) {
        return d.data.name;
      });

});
這是一種放射狀的樹狀圖,繪製的方法差異不大,不過需要將座標進行轉換,來讓節點繞著中心旋轉
一開始將size的部分改成2πR
d3.json(datapath,function(d){
	var dataset = d;
	var tree = d3.tree()
		.size([2 * Math.PI, 600])
		.separation(function(a, b) {
		 	return (a.parent == b.parent ? 1: 2)/a.depth;
		});

	var root = d3.hierarchy(dataset);
利用linkRadial來轉換線的座標
	tree(root);
	var link = g.selectAll(".link")
		.data(root.links())
		.enter().append("path")
		.attr("class", "link")
		.attr("d", d3.linkRadial()
                .angle(function(d) {
                    return d.x;
                })
                .radius(function(d) {
                    return d.y;
                })
            );
再轉換點座標之前先定義用來轉換的方程式
function radialPoint(x, y) {
  return [(y = +y) * Math.cos(x -= Math.PI / 2), y * Math.sin(x)];
}
之後呼叫radialPoint來轉換node的座標
	var node = g.selectAll(".node")
		.data(root.descendants())
		.enter().append("g")
		.attr("class", function(d) {
			return "node" + (d.children ? " node--internal" : " node--leaf");
		})
		.attr("transform", function(d) {
			return "translate(" + radialPoint(d.x, d.y) + ")";
		});

	node.append("circle")
		.attr("r",3);

	node.append("text")
		.attr("dy", "0.31em")
		.attr("x", function(d) {
			return d.x < Math.PI === !d.children ? 6 : -6;
		})
		.attr("text-anchor", function(d) {
			return d.x < Math.PI === !d.children ? "start" : "end";
		})
		.attr("transform", function(d) {
			return "rotate(" + (d.x < Math.PI ? d.x - Math.PI / 2 : d.x + Math.PI / 2) * 180 / Math.PI + ")";
		})
		.text(function(d) {
		return d.data.name;
		});

})
demo & code : https://codepen.io/FanWay/pen/GyBxYb
參考:https://bl.ocks.org/mbostock/4063550