來繼續昨天在設定啟用StackDriver後也收集一天的時間應該資料量的呈現會較為完整,我們就來繼續看看吧!
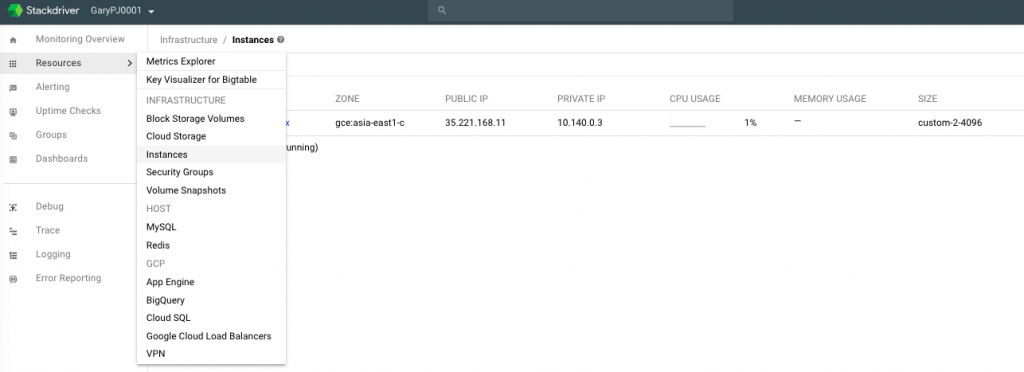
我們當作從來沒有管過這麼多資源的時候從這StackDriver到底能帶給我們甚麼方便之處呢?怎麼進來此頁面可以回頭看上篇,直接殺到有個NFRASTRUCTURE->Resource,其實裡面已經把你大多的IaaS / PaaS常用需要關心的服務類型都放上去了.
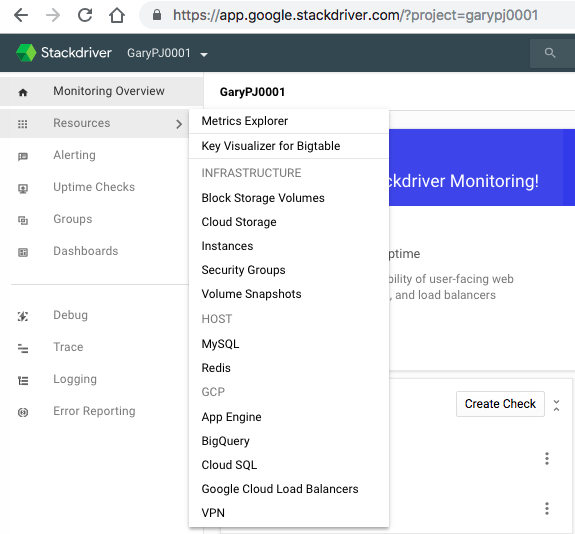
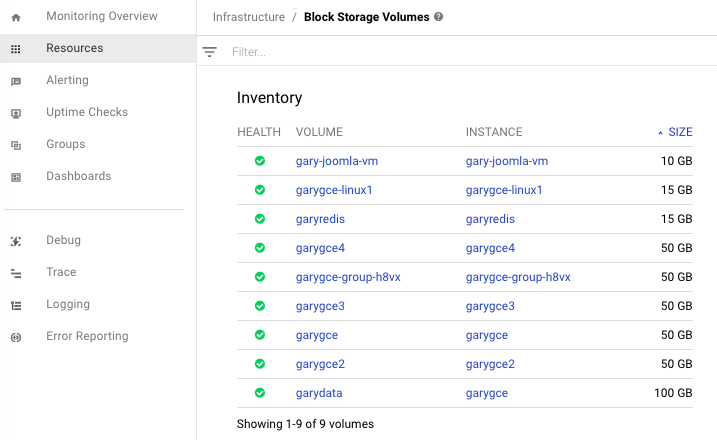
先來看一下此Disk Volume這是目前這專案環境下的所有GCE的硬碟可以一次做資源上的管理
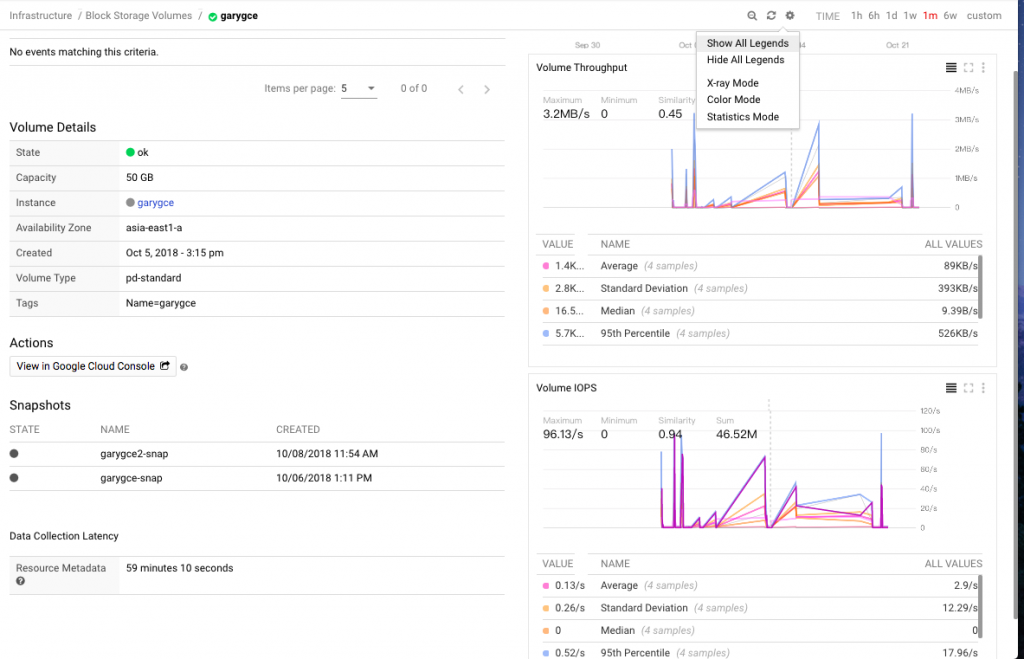
隨意點選一顆磁碟來檢視可以看到左列的Volume Details外也可以清楚知道目前此硬碟的效能狀況
- Volume Throughput
- Volume IOPS
想要查詢的日期請自行選擇後就可以明顯檢視到如上的趨勢圖表

另外趨勢圖上有更細的選項可以做呈現,我覺得最用的到的如下,另外Color / X-Ray只是圖的對比顏色呈現...請依喜好選擇即可...
- toggle legend (切換圖表每個線型對應的參數數據)
- Statistics Mode (可以顯示呈現這類型的總量數據)
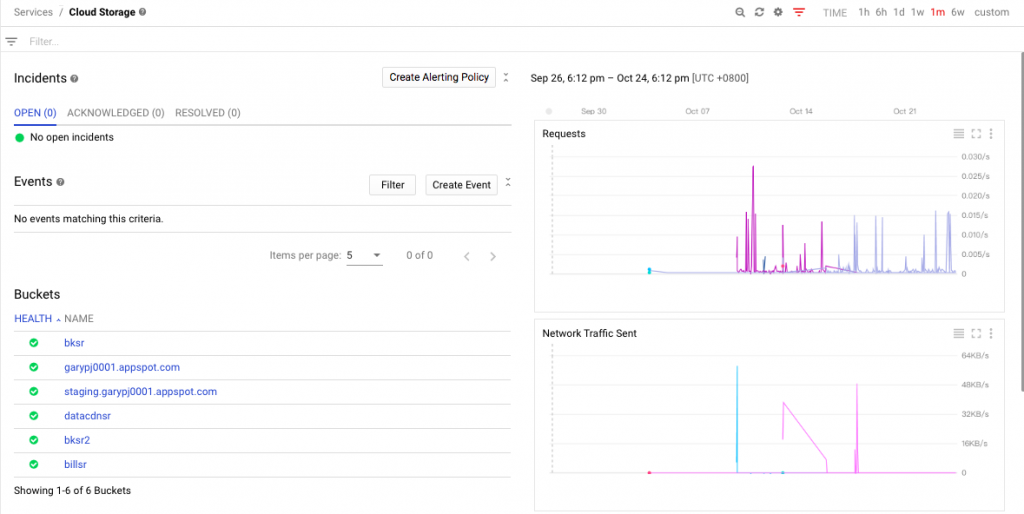
補充一下這每一個資源類型的檢視都一定會有以下三個項目:
Incidents如果是No open incidents沒有最好...
Event事件如果沒有比對顯示空白大部份時間都是好事..
再來以下都是各個資源內的參數資源範例讓大家方便參考
Cloud Storage--->就同等S3 / Blob Storage
- Requests
- Network Traffic Sent
- Network Traffic Received
- Object Count (存取次數)
- Object Size (每個所佔的物件總量)
就抽樣拿個Object Size來實際比對一下
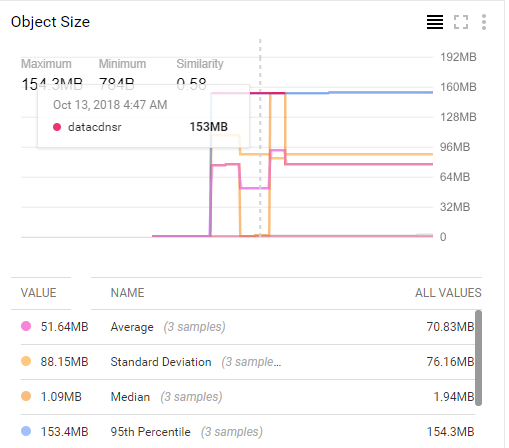
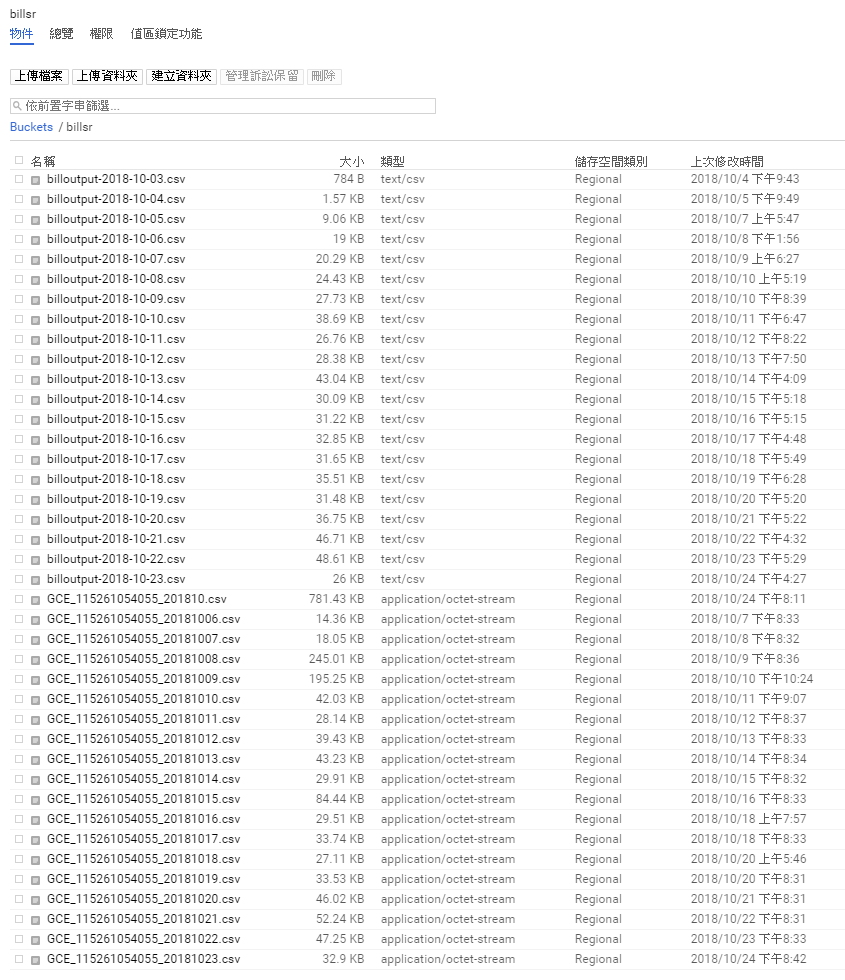
BKSR上的確是差不多的大小,其它因為都是Copy這檔案到其他Storage所以是沒錯的

來看看自動匯入的Billing帳單Log,目測看起來是差不多....
從上述的作法是不是每個動作都要點進去好幾層才能看到單一資訊...所以統一監看是有好處的
此個體只顯示有開機的才會被歸納於此來看,不過我覺得這透過GCE總覽可能更方便
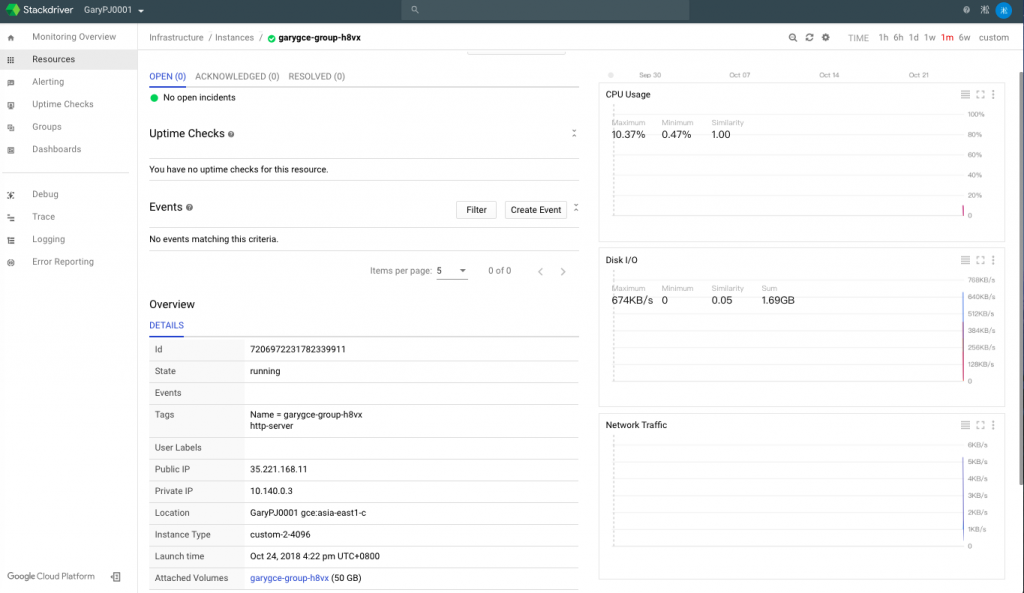
個體GCE裡面能看到的圖表歸納如下:
- CPU Usage
- Disk I/O
- Network Traffic
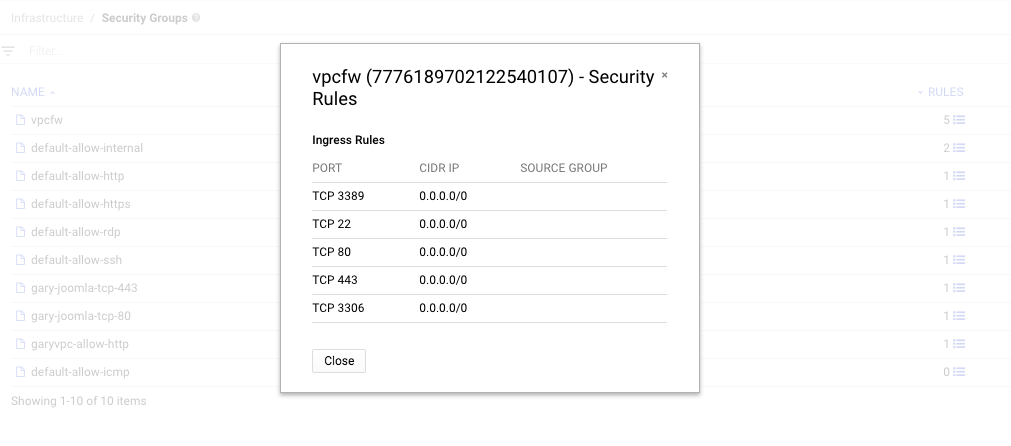
這是總覽安全群組(就是能否進出流量的L4防火牆啦)
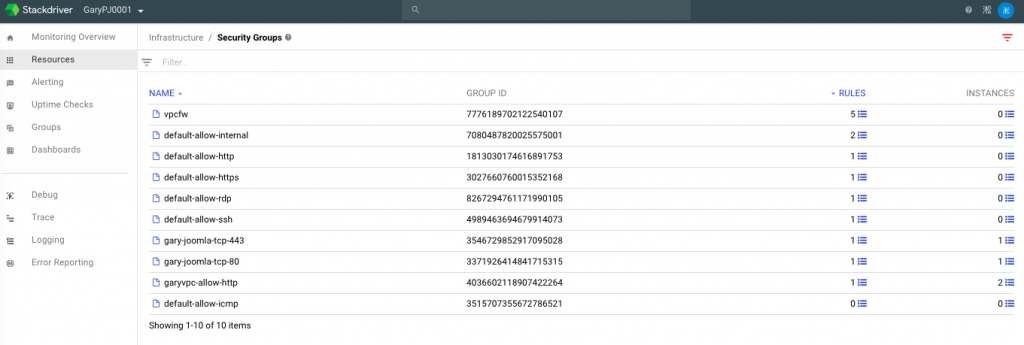
這查找Policy問題滿方便的可以直接簡單的畫面就可以一目了然
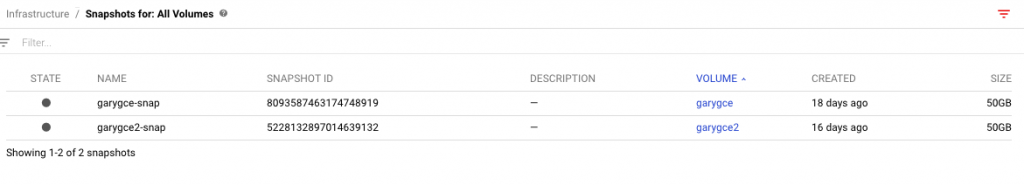
可以一次看整個快照磁碟的紀錄..不過沒有再進階的檢視就像是清單列表
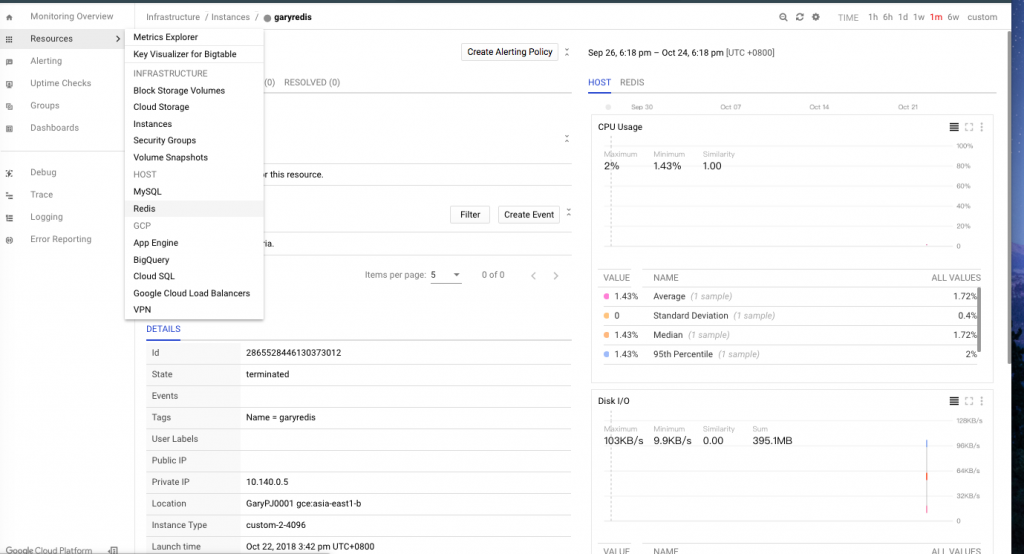
這是MemoryStore(Redis)所需搭配檢視的圖表
Host主機層級:
- CPU Usage
- Disk I/O
- Network Traffic
Redis個體:
- Redis Client Connections
- Redis Slave Connections
- Redis Memory Usage
- Redis Operations
- Redis Expired Keys
- Redis PubSub
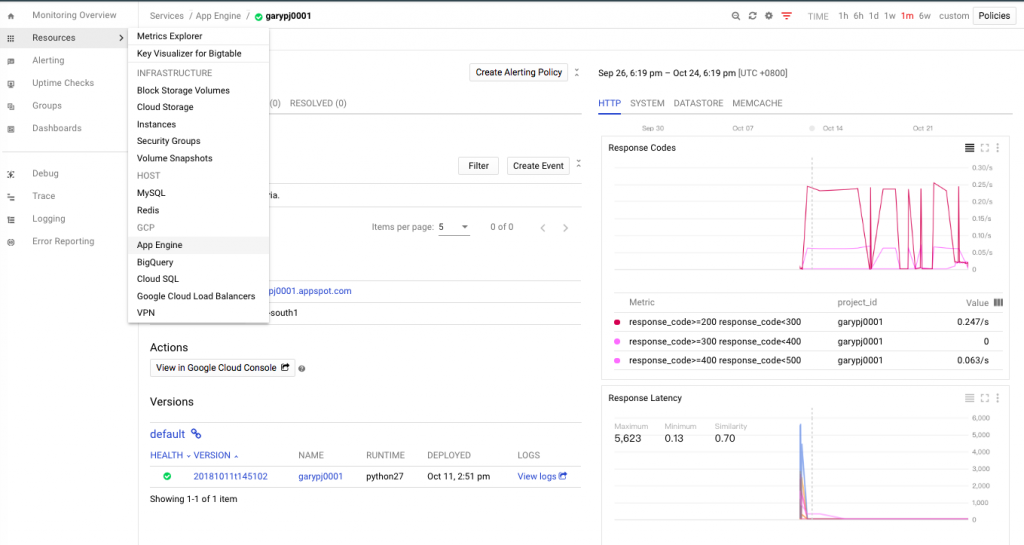
這是GAE網站所需搭配檢視的圖表
Http:
- Response Codes
- Response Latency
- Response Styles(舉例是否做Caahe,動態等等的統計數據..)
System:
- Instance Counts
- CPU Usage (megacycles)
- Flexible CPU Usage
- Memory Usage
- Network I/O
- Flexible Disk I/O
DataStore:
- Datastore Total Operations
- Datastore Errors
- Datastore Operations
- Datastore Read Sizes
- Datastore Write Sizes
MemoryCache:
- Memcache Total Operations
- Memcache Utilization
- Memcache Operations
- Memcache Network I/O
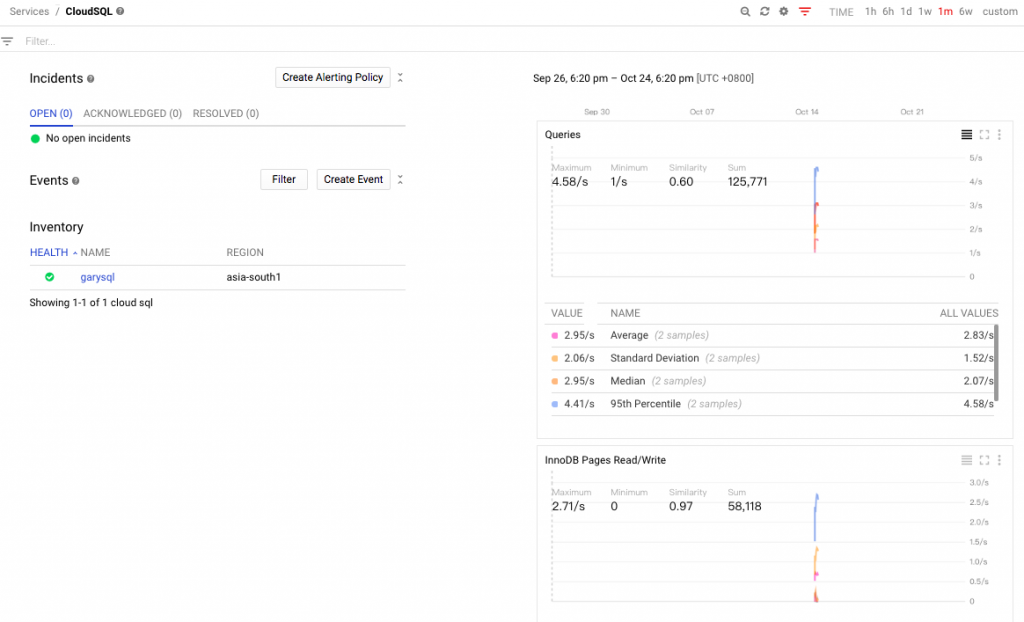
這是CloudSQL網站所需搭配檢視的圖表
- Queries
- InnoDB Pages Read/Write
- Network Connections
- CPU Utilization
- Memory Utilization
- Disk Utilization
- Available for Failover
- Seconds Behind Master
統一檢視負載平衡服務
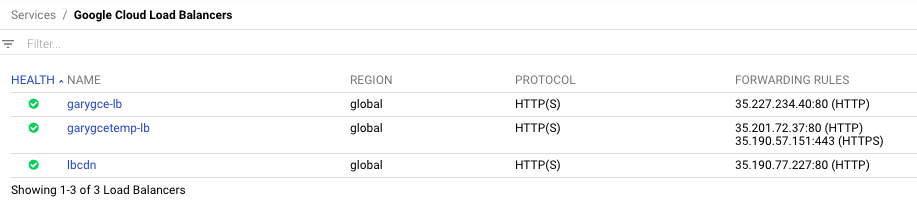
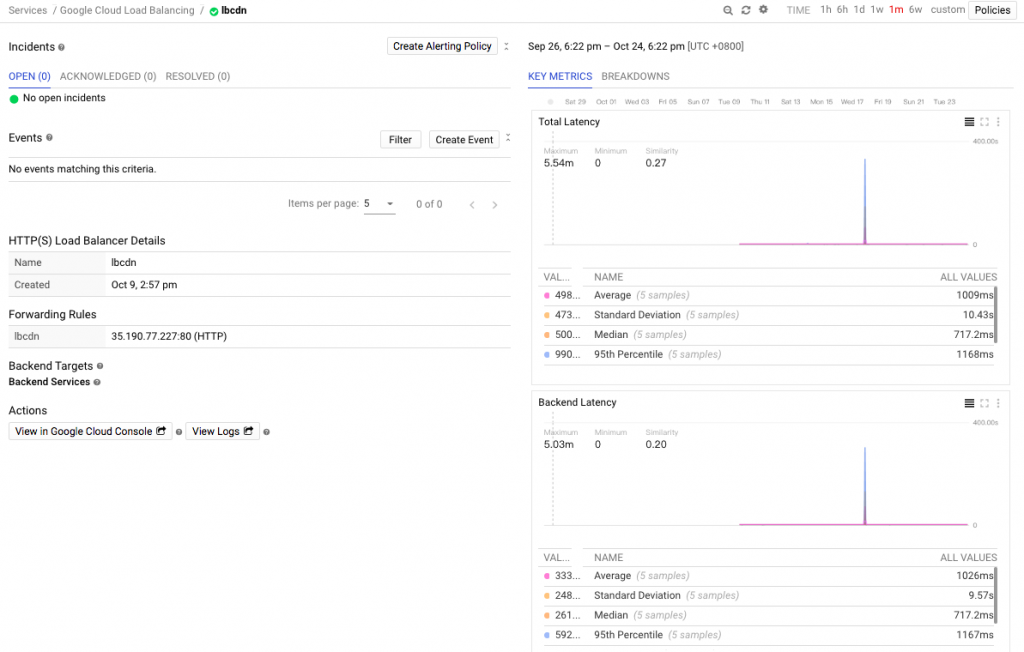
這是Load Balancer所需搭配檢視的圖表
Key Metrics:
- Total Latency
- Backend Latency
- Frontend RTT
- Requests
- Response by Response Code Class
- Response Ratio by Code Class
- Response by Code
- Request Throughput
- Response Throughput
Breakdowns(損壞檢視):
- Total Latency 95%
- Backend Latency 95%
- Frontend RTT 95%
- Requests
- Response by Response Code Class
- Response Throughput
- Request Throughput
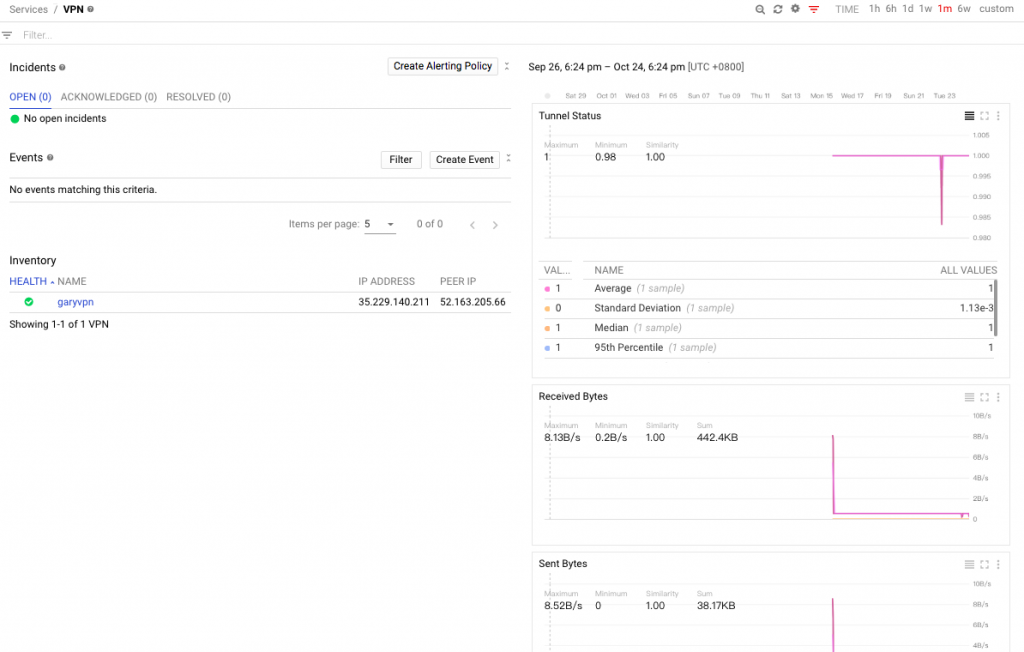
最後一個展示的是VPN所需搭配檢視的圖表
- Tunnel Status
- Received Bytes
- Sent Bytes
- Dropped Packets
畢竟監視的東西都是繁瑣無趣的,把目前用的到的參數都列出方便查找檢視之用,今天就先到這,81