iT邦幫忙

2019 iT 邦幫忙鐵人賽

DAY 29
0
Everything on Azure

Azure Machine Learning Studio系列 第 29

Azure Machine Learning Studio 搭配 Power BI 可視化模型

  • 分享至 

  • xImage
  •  

若預測模型建置完成,可能會需要依據預測的結果,製作報告或執行公司決策等等,為了方便解釋結果,可以搭配 Power BI 可視化預測的相關數據資料,以下範例是將成人收入預測模型的部分資料製作成圖表
Power BI 官網:https://powerbi.microsoft.com/

  1. 新增 Convert to CSV,將預測結果輸出成 CSV 檔,接著點選 Download 下載下來
    https://ithelp.ithome.com.tw/upload/images/20181111/20111935uwVC32zkWo.png

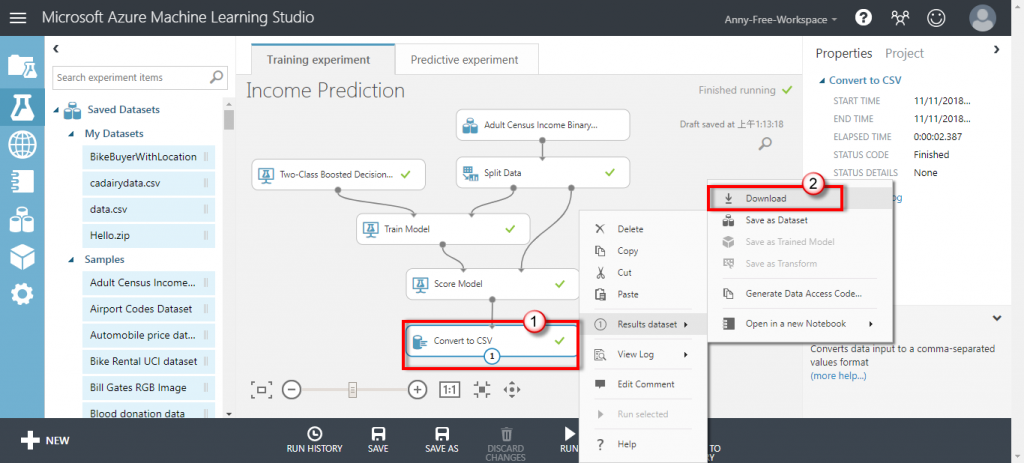
  2. 開啟 Power BI Desktop,點選 Get Data / CSV,匯入下載的 CSV 檔
    https://ithelp.ithome.com.tw/upload/images/20181111/20111935NlD4izTCwd.png

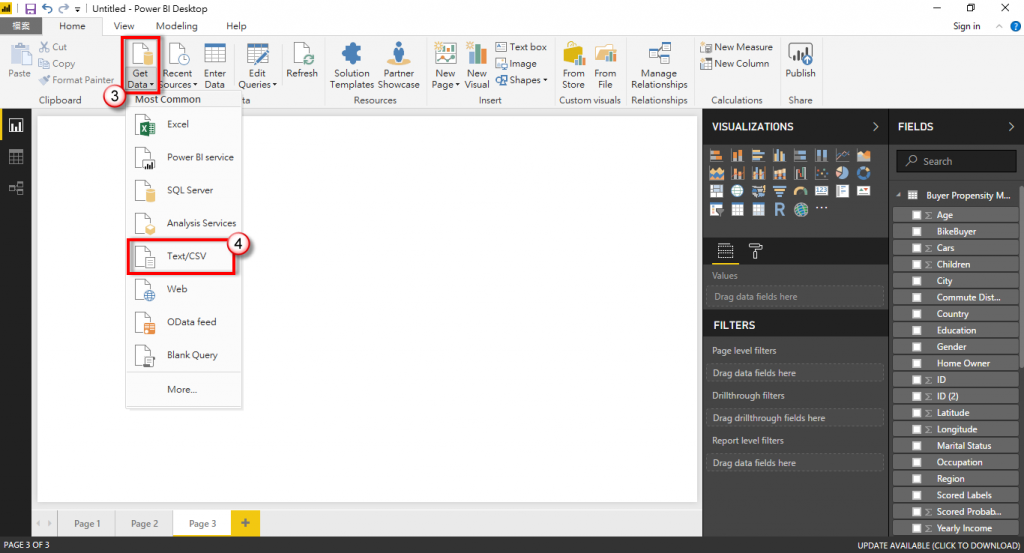
  3. 點選 Load 匯入資料,匯入後資料欄位會顯示在右手邊的視窗
    https://ithelp.ithome.com.tw/upload/images/20181111/20111935DXnvTTdjUd.png

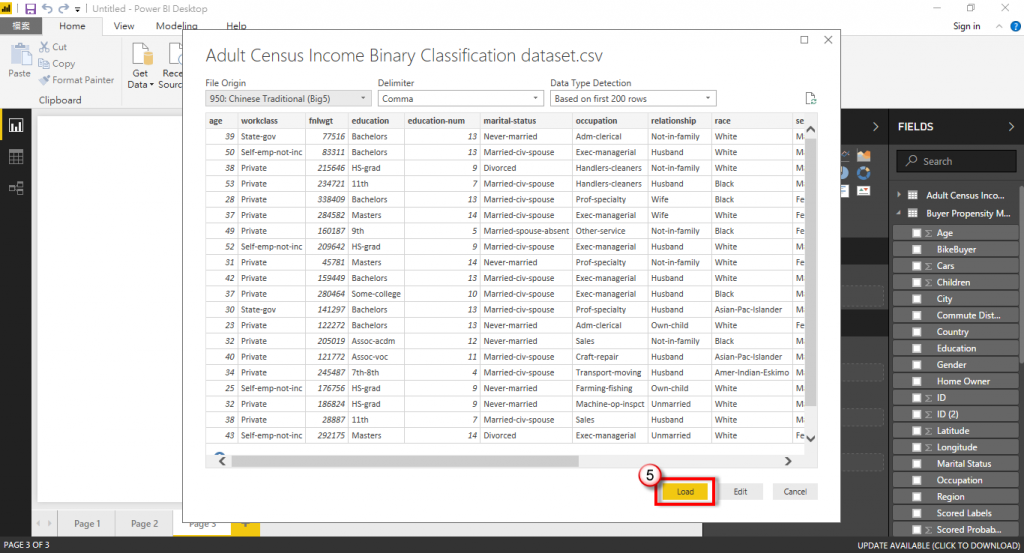
  4. 選擇圖表樣式,例如:資料有包含國家或城市,就可以直接新增地圖顯示
    https://ithelp.ithome.com.tw/upload/images/20181111/201119352fv4pMgz3r.png

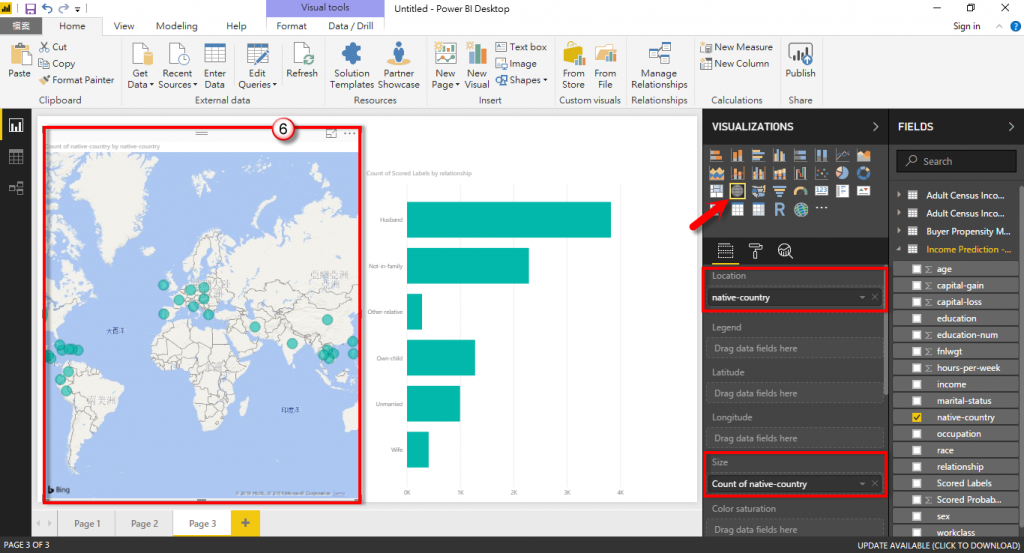
  5. 若想看某一資料欄位與預測結果的關係,可以選擇長條圖,例如:下圖為成人家庭成員與收入預測結果的關係
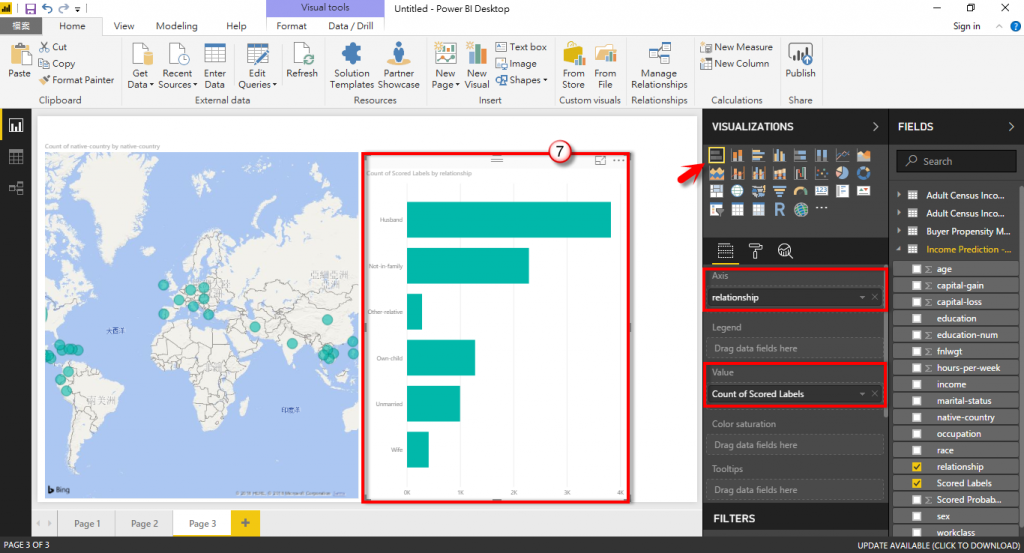
    https://ithelp.ithome.com.tw/upload/images/20181111/20111935UpMgswRqZy.png


上一篇
Azure Machine Learning Studio 將實驗發佈成 Web Service
下一篇
Azure Machine Learning Studio 資源庫 Azure AI Gallery
系列文
Azure Machine Learning Studio30
圖片
  直播研討會
圖片
{{ item.channelVendor }} {{ item.webinarstarted }} |
{{ formatDate(item.duration) }}
直播中

尚未有邦友留言

立即登入留言