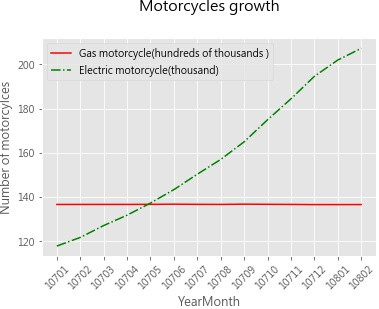
Hi! 大家好,我是Eric,上篇教大家如何用Python畫圓餅圖了,這次要教大家畫折線圖。
![]()
1. 載入套件。
import pandas as pd               # 資料處理套件
import matplotlib.pyplot as plt   # 資料視覺化套件
2. 載入資料。
motor = pd.read_csv("number of motorcycle.csv")
motor.head(3)    # 顯示前3筆資料

3. 資料操作。
由於載入資料後,YearMonth欄位的資料類型是整數,我們必須將它轉換成字串類別
ym = [None] * len(motor["YearMonth"])     # 建立一個空列表,數量為年月的數量

# 以for迴圈逐一將年月資料類別轉成字串類別
for i in range(len(motor["YearMonth"])):
    ym[i] = str(motor["YearMonth"][i])

motor["YearMonth"] = ym  # 將原本年月欄位資料替換掉
4. 開始畫圖。
plt.style.use("ggplot")               # 使用ggplot主題樣式

#畫第一條線,plt.plot(x, y, c)參數分別為x軸資料、y軸資料及線顏色 = 紅色
plt.plot(motor["YearMonth"], motor["Gas(hundreds of thousands )"],c = "r")
#畫第二條線,plt.plot(x, y, c)參數分別為x軸資料、y軸資料、線顏色 = 綠色及線型式 = -.
plt.plot(motor["YearMonth"], motor["Electric(thousand)"], "g-.")

# 設定圖例,參數為標籤、位置
plt.legend(labels=["Gas motorcycle(hundreds of thousands )	", "Electric motorcycle(thousand)"], loc = 'best')
plt.xlabel("YearMonth", fontweight = "bold")                # 設定x軸標題及粗體
plt.ylabel("Number of motorcylces", fontweight = "bold")    # 設定y軸標題及粗體
plt.title("Motorcycles growth", fontsize = 15, fontweight = "bold", y = 1.1)   # 設定標題、文字大小、粗體及位置
plt.xticks(rotation=45)   # 將x軸數字旋轉45度,避免文字重疊

plt.savefig("Motorcycles growth.jpg",   # 儲存圖檔
            bbox_inches='tight',               # 去除座標軸占用的空間
            pad_inches=0.0)                    # 去除所有白邊
plt.close()      # 關閉圖表
5. 大功告成。
可以看出燃油機車數量變動不大,而電動機車數量目前呈現穩定地逐年上升。
P.S. 本篇程式碼為參考plusone團隊-[Day19]Matplotlib資料視覺化進階!,並利用網路實際的開放資料執行
